
Abstract
Social media platforms like Twitter (now X) serve as vital arenas for public discourse but are marked by high content volatility, particularly due to tweet deletions. These deletions may stem from personal reconsideration or indicate coordinated, strategic behavior. This study investigates deletion patterns in two large-scale datasets: general discourse (TweetsKB) and COVID-19-related discourse (TweetsCOV19), with a focus on how deletion behavior is influenced by topic and ideological polarization across political and scientific dimensions. We find that 29% of TweetsKB and 23% of TweetsCOV19 tweets are deleted within a year of posting. Deleted tweets tend to express more negative sentiment than retained ones. In both datasets, polarized tweets show lower overall deletion rates, while tweets polarized along the science dimension are more likely to be deleted than politically polarized tweets. These findings reveal how deletion dynamics intersect with the structure of online debate, offering insights into the lifecycle of digital discourse and the impact of polarization on content persistence.
Introduction
Twitter (now X) has become one of the most popular platforms for societal debate [19]. Information on Twitter is highly volatile and shows decay over time as tweets are deleted. Users may delete content to avoid personal embarrassment, while bulk deletions are indicative of contributing to malicious campaigns [3, 4, 21]. Deleting tweets in bulk or even posting them in bulk to be bulk deleted is abusing the platform’s delete facility [20]. Specific tweet deletion pattern have been analyzed with respect to individuals’ agenda [24], quality of content or type of information [4], dataset incompleteness i.e., decay over time [17, 25], hate speech [20], automated bulk deletions [4, 22] and AstroTurfing campaigns [3, 21] to name a few. Tweet deletion poses a harm by manipulating the trending algorithms [8, 21] and exploration at high magnitude.
Polarization on Twitter in general discourse [13], politics [5, 11] or climate change [18] has users tweeting and retweeting what is strongly aligned with their ideological leaning. In literature, tweet polarization is investigated using network analysis [5, 11], content analysis [1, 15, 23], or a hybrid of the two approaches [15, 23]. Political topics indicate preferential linking as people consume content that strengthens their beliefs [1, 12]. However, they also do not stop the inflow of information from opposing ideologies [7], where opposing hashtags offer higher penetration into the audience of the opposite leaning for a different perspective [23]. The COVID-19 pandemic is another example of highly polarized discourse for which tweet deletion patterns are yet to be explored. Thus, in this work, we study the following questions: RQ1: How do general discourse deletion patterns differ from COVID-19 deletion patterns? RQ2: What is the effect of polarization along the political and science dimensions on the deletion patterns in COVID-19 and general discourse? To answer the first research question, we analyze the general discourse on Twitter represented by the TweetKB dataset and the COVID-19-related discourse represented by the TweetsCOV19 dataset (cf. Section 2). For the second research question, we look at their polarized subsets, i.e., TweetsKB<sub>pol</sub> and TweetsCOV19<sub>pol</sub> (cf. Section 3). To assign a tweet a polarization score according to a polarization dimension (i.e., political, science), we rely on an external resource, i.e., URLs in tweets identified as pay-level-domains (PLDs) on Media Bias/Fact Check (MBFC)<sup>1</sup>. We consider tweets that were no longer accessible as of May 2021–approximately one year after the last tweets in both datasets were posted–as deleted.
We find that 29% of tweets are deleted in TweetsKB compared to 23% in TweetsCOV19. The deletion percentage for TweetsKB remains stable over time while for TweetsCOV19 it slightly decreases after the lockdown around March 2020. In both datasets, the deleted tweets have higher negative sentiment scores and lower positive sentiment scores than non-deleted while on average TweetsKB exhibits a positive and TweetsCOV19 a negative sentiment. The tweet deletion percentages for the polarized subsets TweetsKB<sub>pol</sub> and TweetsCOV19<sub>pol</sub> are 19.52% and 16.14%, which is lower than for TweetsKB and TweetsCOV19. The science polarization dimension exhibits higher deletion rates than the political for both datasets. We also find that after deletion, the polarization scores distribution for the science dimension of the remaining tweets is less skewed towards anti-science tweets, resulting in a more balanced content.
Tweet distribution for TweetsKB and TweetsCOV19.
Tweets | TweetsKB | TweetsCOV19 |
|---|---|---|
Posted | $9,409,841(100%)$ | $9,409,841(100%)$ |
Deleted | $2,722,577 (29%)$ | $2,137,501 (23%)$ |
Non-deleted | $6,687,264 (71%)$ | $7,272,340 (77%)$ |
User distribution for TweetsKB and TweetsCOV19.
Users | TweetsKB | TweetsCOV19 |
|---|---|---|
Total | $5,208,425(100%)$ | $4,095,876(100%)$ |
Deleted ≥ 1 | $1,595,037 (31%)$ | $1,079,023 (26%)$ |
Deleted = 0 | $3,613,388 (69%)$ | $3,016,853 (74%)$ |
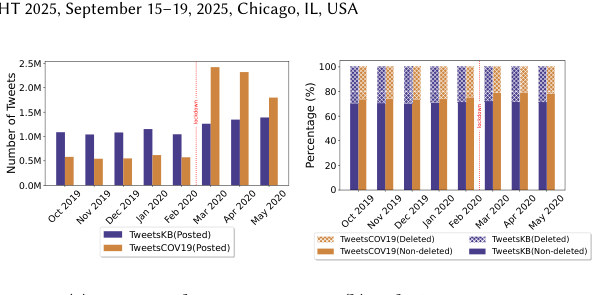
Figure 1: Tweet volume and deletion percentage over time.
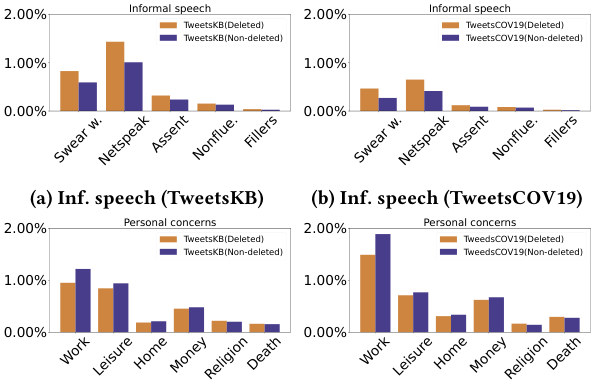
Figure 2: Informal speech and personal concerns in deleted and non-deleted tweets for TweetsKB and TweetsCOV19.
Characterizing COVID-19 and the General Discourse Deletion Patterns
To study differences in the tweet deletion patterns of the general and the COVID-19-related discourse on Twitter (RQ1), we resort to the TweetsKBarchive with more than 13B tweets, having 3B English tweets. They are harvested over a decade through the public Twitter streaming API [9]. We extracted 9.4M tweets using a seed list of 268 COVID-19-related terms<sup>2</sup>[6] (from Oct. 2019 to May 2020) referred to as TweetsCOV19. For fair analysis, 9.4M tweets are randomly sampled from the TweetsKBarchive for the same period referred to as TweetsKB. The two datasets have an overlap of 4.9% and represent the general and the COVID-19-related discourse on Twitter for the analyzed period.
Table 1 shows percentages of posted, deleted, and non-deleted tweets for TweetsKB and TweetsCOV19. About a year after the last tweets in both datasets had been published, 29% of the tweets were deleted in TweetsKB compared to 23% in TweetsCOV19. In terms of the number of users, both datasets differ significantly, as the number of users in TweetsKB is about 5.2M, much higher than the about 4M users in TweetsCOV19 (cf. Table 2). In TweetsKB, there are more deleting users (31%) than in TweetsCOV19 (26%). The average number of deleted tweets by a user is about 0.52 in both datasets. However, considering only users with one or more deletions, TweetsCOV19 deleting users have 1.98 deletions on average, which is higher than TweetsKB deleting users, who have 1.71 deletions on average.
Figure 1 shows the tweet volume and deletion percentage over time for TweetsKB and TweetsCOV19. Following the lockdown in early March 2020, when people were required to stay at home, both datasets show a noticeable surge in tweet activity (cf. Figure 1 (a)). We also observe that the deletion percentage of about 29% remains stable over the whole period for TweetsKB, while for TweetsCOV19, the deletion percentage slightly decreases after the lockdown (cf. Figure 1 (b)).
Sentiment Analysis.
Sentiment | TweetsKB — Deleted | TweetsKB — Non-deleted | TweetsCOV19 — Deleted | TweetsCOV19 — Non-deleted |
|---|---|---|---|---|
Positive | 1.655 | 1.703 | 1.578 | 1.585 |
Average | 0.082 | 0.157 | -0.085 | -0.007 |
Negative | -1.572 | -1.546 | -1.663 | -1.593 |
To better characterize these deletion patterns, we perform a linguistic analysis of deleted and non-deleted tweets. For sentiment analysis, we resort to sentiment scores estimated using the SentiStrength tool<sup>3</sup>. Table 3 presents the mean of sentiment scores (positive, negative and average) calculated per day over the whole time period for each dataset, separately for deleted and non-deleted tweets. We observe that on average TweetsKB has positive sentiments while TweetsCOV19 has negative sentiments, independent of tweet type. Deleted tweets have higher negative sentiment scores and lower positive sentiment scores than non-deleted. The linguistic inquiry and word count (LIWC) analysis of deleted tweets and non-deleted tweets (cf. Figure 2) expands on the sentiment analysis along the informal speech and personal concerns measures in the psychological processes category of LIWC. In the informal speech measure, TweetsKB representing the general discourse on Twitter contains more swear words and netspeak language than the COVID-19-related discourse in TweetsCOV19 (cf. Figure 2 (a, b)). In the personal concerns measure, money and work are more frequently mentioned in TweetsCOV19 than in TweetsKB (cf. Figure 2 (c, d)). Non-deleted tweets in both datasets have a higher ratio of words in the personal concerns measure than deleted tweets. On the other hand, we observe that deleted tweets contain more informal speech in both datasets compared to non-deleted tweets.
Characterizing Deletion Patterns with Respect to Political and Science Polarization
Tweet distribution for TweetsKBpol and TweetsCOV19pol.
TweetsKB<sub>pol</sub> | Posted | Deleted | Non-deleted |
|---|---|---|---|
Political | 133,676 (79.72%) | 19,849 (11.84%) | 113,827 (67.88%) |
Science | 34,081 (20.33%) | 12,912 (7.70%) | 21,169 (12.62%) |
Total | 167,757 (100%) | 32,761 (19.52%) | 134,996 (80.48%) |
TweetsCOV19<sub>pol</sub> | Posted | Deleted | Non-deleted |
Political | 611,835 (80,53%) | 73,183 (9.63%) | 538,652 (70.90%) |
Science | 148,308 (19.52%) | 49,542 (6.52%) | 98,766 (13.00%) |
Total | 760,143 (100%) | 122,725 (16.14%) | 637,418 (83.86%) |
User distribution for TweetsKBpol and TweetsCOV19pol.
Political | TweetsKB<sub>pol</sub> | TweetsCOV19<sub>pol</sub> |
|---|---|---|
Total | 67,511 (100%) | 176,301 (100%) |
Deleted ≥ 1 | 12,392 (18.35%) | 30,765 (17.45%) |
Deleted = 0 | 55,119 (81.65%) | 145,536 (82.55%) |
Science | TweetsKB<sub>pol</sub> | TweetsCOV19<sub>pol</sub> |
Total | 15,325 (100%) | 44,493 (100%) |
Deleted ≥ 1 | 5,051 (32.96%) | 12,782 (28.73%) |
Deleted = 0 | 10,274 (67.04%) | 31,711 (71.27%) |
To study the effect of polarization on tweet deletion patterns (RQ1), we extracted TweetsKB<sub>pol</sub> and TweetsCOV19<sub>pol</sub> from TweetsKB and TweetsCOV19, respectively. We follow the categorization schema and methodology introduced by Rao et al.[18] to define two polarization dimensions, i.e., political, science, and compute polarization scores. Along the political dimension, liberals are represented by the union of (left-biased and left-center) and conservatives by the union of (right-biased and right-center) MBFC pay-level domains (PLDs) categories. Along the science dimension, pro-science is represented by (pro-science) and anti-science by the union of (conspiracy-pseudoscience and questionable-source) MBFC PLD categories. We consider only tweets containing URLs with PLDs from the aforementioned dimensions to be polarized and part of TweetsKB<sub>pol</sub> and TweetsCOV19<sub>pol</sub>. Tweets that share the same number of URLs from domains with opposite biases have a polarization score of zero and thus are considered neutral with respect to a given polarization dimension; all other tweets are considered non-neutral as they possess polarization scores leaning towards conservative or liberal for the political dimension and towards pro- and anti-science for the science dimension. The polarization score of a user is the average of the polarization scores of her tweets. Please note that tweets and users can be polarized simultaneously along the political and the science dimensions.
In total, we have 167,757 tweets and 79,041 users in TweetsKB<sub>pol</sub> and 760,143 tweets and 205,084 users in TweetsCOV19<sub>pol</sub>. Table 4 offers the percentage of posted tweets and their separation into deleted and non-deleted against a given polarization dimension in the two datasets, including neutral tweets. Comparing the political and science dimensions for both datasets, the table shows that more political tweets are deleted than science tweets. Similar to our initial observation for TweetsKB and TweetsCOV19, here again, more tweets are deleted in TweetsKB<sub>pol</sub> (19.52%) than in TweetsCOV19<sub>pol</sub> (16.14%). However, these tweet deletion percentages are lower than the respective percentages for the supersets TweetsKB and TweetsCOV19 (cf. Table 1). Table 5 shows that, in TweetsKB<sub>pol</sub>, 18.35% of users in the political dimension and 32.96% in the science dimension have had at least one tweet deleted. For TweetsCOV19<sub>pol</sub>, the corresponding percentages are 17.45% and 28.73%, respectively. Table 6 shows the users by polarization dimensions, where we see similar percentages for liberal and conservatives in both datasets, while the TweetsCOV19<sub>pol</sub> dataset exhibits about 10% more pro-science users than TweetsKB<sub>pol</sub>.
Users distribution by political leaning for TweetsKBpol and TweetsCOV19pol.
Political | TweetsKB<sub>pol</sub> | TweetsCOV19<sub>pol</sub> |
|---|---|---|
Liberal | 51,060 (75.63%) | 135,174 (76.67%) |
Conservative | 14,967 (22.17%) | 36,179 (20.52%) |
Neutral | 1,484 (2.20%) | 4,948 (2.81%) |
Science | TweetsKB<sub>pol</sub> | TweetsCOV19<sub>pol</sub> |
Pro-science | 4,769 (31.12%) | 18,352 (41.25%) |
Anti-science | 10,493 (68.47%) | 25,591 (57.52%) |
Neutral | 63 (0.41%) | 550 (1.23%) |
Next, we study the polarization scores distribution for tweets for each polarization dimension and how user reputation may affect deletion patterns. We only present the results for TweetsKB<sub>pol</sub> as similar patterns can be observed for TweetsCOV19<sub>pol</sub>. Figure 3 shows the tweet polarization distributions for posted, deleted and non-deleted tweets in TweetsKB<sub>pol</sub>. Along the political dimension, there are more liberal tweets than conservative ones (a). A similar pattern can be observed for the deleted tweets (c), resulting in non-deleted tweets having again a distribution more skewed towards liberal content (e). Along the science dimension, there are more anti-science tweets posted, leading to a distribution skewed towards anti-science content (b). However, while about half of the anti-science tweets are deleted, very few pro-science tweets are removed (d), leading to a higher proportion of non-deleted pro-science tweets and a less anti-science skewed distribution (f). To calculate a reputation score for each user, we resort to a simple measure similar to [14], i.e., the ratio of the number of followers and followees per user. Figure 4 shows the number of posted (a), deleted (c) and non-deleted (e) tweets for users with a given polarization score and reputation for the political dimension for TweetsKB<sub>pol</sub>. Interestingly, more tweets on both sides of the political spectrum are deleted for users with an average reputation. However, the pattern differs for the science polarization dimension, where we observe that most of the posted (b) and deleted (d) anti-science tweets are by users with moderate reputations while pro-science tweets are not deleted as often.
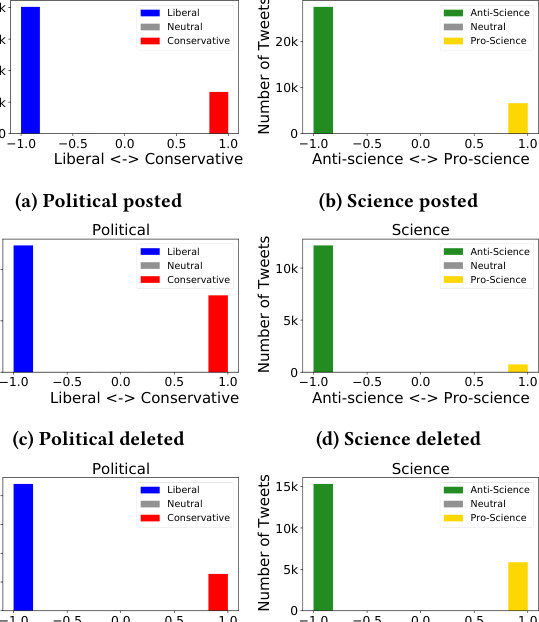
Figure 3: Tweet polarization for TweetsKBpol. Neutral tweets (in gray) are not visible due to their low numbers.
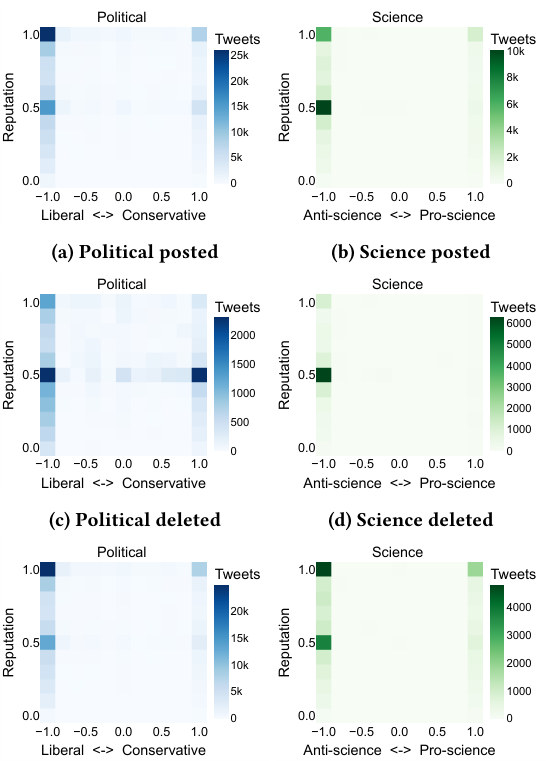
Figure 4: Tweets deletion heatmaps based on user reputation and polarization for TweetsKBpol.
Discussion and Conclusion
In this study, we found that the general Twitter discourse represented by TweetsKB exhibits higher deletion percentages than the COVID-19 discourse represented by TweetsCOV19. Over the investigated period, the tweet deletion percentage for TweetsKB, TweetsCOV19 and their polarized subsets remained in the exacted ranges as from previous studies [25]. A clear limitation of our work lies in how tweet deletion is defined. Specifically, we do not differentiate between the various reasons a tweet may become inaccessible–such as account deletion, account suspension, or a change in privacy settings. Instead, we treat a tweet as deleted if it cannot be accessed approximately one year after the last tweet in the dataset was posted. A recent study on data decay on Twitter also identified zombie tweets that could not be accessed in the first round but were accessible in the second round a year later [2]. The results of our linguistic analysis performed for deleted and non-deleted tweets expand on previous studies that have reported strong opinions and uninteresting content [4], sharing personal information [10], and topics discussed [16] as reasons for tweet deletion.
For the polarized subsets of TweetKB and TweetsCOV19, we find that more political tweets are deleted than science tweets. We also find that after deletion, the polarization scores distribution for the science dimensions of the remaining tweets is less skewed towards anti-science tweets. Polarization in our study is determined by mapping URLs in tweets to pay-level domains (PLDs) classified by an external resource, Media Bias/Fact Check (MBFC). This approach introduces a limitation, as it excludes tweets that may exhibit political or science polarization but do not contain URLs to domains not covered by MBFC. As a result, our analysis may not capture the full spectrum of polarized discourse present in the datasets.
We hope that our findings contribute to a better understanding of the dynamics of information persistence and deletion on social media platforms, particularly in the context of polarization and public discourse. They also have implications for researchers relying on historical Twitter data, as deletion biases may shape the representation of discourse over time. Future work may extend this analysis to additional topics, platforms, or temporal windows to further explore how sociopolitical context influences digital memory.
Acknowledgments
We express our gratitude to Mohammad Samani for his contribution to developing the initial modules of this research.
Notes
References
[1]Lada A Adamic and Natalie Glance. 2005. The political blogosphere and the 2004 US election: divided they blog. In Proceedings of the 3rd international workshop on Link discovery. Association for Computing Machinery, New York, NY, USA, 36–43. [2]Dennis Assenmacher, Indira Sen, Leon Fröhling, and Claudia Wagner. 2020. The End of the Rehydration Era The Problem of Sharing Harmful Twitter Research Data. The End of the Rehydration Era The Problem of Sharing Harmful Twitter Research Data (2020), 1–10. [3]Marco Bastos. 2021. This account doesn’t exist: Tweet decay and the politics of deletion in the Brexit debate. American Behavioral Scientist 65, 5 (2021), 757–773. [4]Parantapa Bhattacharya and Niloy Ganguly. 2016. Characterizing deleted tweets and their authors. In Tenth international AAAI conference on web and social media. AAAI, Washington, DC 20004 USA, 547–550. [5]Michael Conover, Jacob Ratkiewicz, Matthew Francisco, Bruno Gonçalves, Filippo Menczer, and Alessandro Flammini. 2011. Political polarization on twitter. In Proceedings of the international aaai conference on web and social media , Vol. 5. AAAI, Washington, DC 20004 USA, 89–96. [6]Dimitar Dimitrov, Erdal Baran, Pavlos Fafalios, Ran Yu, Xiaofei Zhu, Matthäus Zloch, and Stefan Dietze. 2020. Tweetscov19-a knowledge base of semantically annotated tweets about the covid-19 pandemic. In Proceedings of the 29th ACM International Conference on Information & Knowledge Management. ACM, Association for Computing Machinery, New York, NY, USA, 2991–2998. [7]Elizabeth Dubois and Grant Blank. 2018. The echo chamber is overstated: the moderating effect of political interest and diverse media. Information, communication & society 21, 5 (2018), 729–745. [8]Tuğrulcan Elmas, Rebekah Overdorf, Ahmed Furkan Özkalay, and Karl Aberer. 2021. Ephemeral astroturfing attacks: The case of fake twitter trends. In 2021 IEEE European Symposium on Security and Privacy (EuroS&P). IEEE, IEEE, New York, NY, USA, 403–422. [9]Pavlos Fafalios, Vasileios Iosifidis, Eirini Ntoutsi, and Stefan Dietze. 2018. Tweetskb: A public and large-scale rdf corpus of annotated tweets. In The Semantic Web: 15th International Conference, ESWC 2018, Heraklion, Crete, Greece, June 3–7, 2018, Proceedings 15. Springer, Springer, Cham, 6330 Cham, Switzerland, 177–190. [10]Alisa Gazizullina and Manuel Mazzara. 2019. Prediction of Twitter Message Deletion. In 2019 12th International Conference on Developments in eSystems Engineering (DeSE). IEEE, IEEE, New York, NY, USA, 117–122. [11]Anatoliy Gruzd and Jeffrey Roy. 2014. Investigating political polarization on Twitter: A Canadian perspective. Policy & internet 6, 1 (2014), 28–45. [12]Eszter Hargittai, Jason Gallo, and Matthew Kane. 2008. Cross-ideological discussions among conservative and liberal bloggers. public Choice 134 (2008), 67–86. [13]Philipp Lorenz-Spreen, Lisa Oswald, Stephan Lewandowsky, and Ralph Hertwig. 2022. A systematic review of worldwide causal and correlational evidence on digital media and democracy. Nature human behaviour 7, 1 (2022), 1–28. [14]Krissada Maleewong. 2016. An analysis of influential users for predicting the popularity of news tweets. In PRICAI 2016: Trends in Artificial Intelligence: 14th Pacific Rim International Conference on Artificial Intelligence, Phuket, Thailand, August 22-26, 2016, Proceedings 14. Springer, Springer, Cham, 6330 Cham, Switzerland, 306–318. [15]Saif M Mohammad, Parinaz Sobhani, and Svetlana Kiritchenko. 2017. Stance and sentiment in tweets. ACM Transactions on Internet Technology (TOIT) 17, 3 (2017), 1–23. [16]Sasa Petrovic, Miles Osborne, and Victor Lavrenko. 2013. I wish i didn’t say that! analyzing and predicting deleted messages in twitter. arXiv preprint arXiv:https://arXiv.org/abs/1305.3107 (2013). [17]Juergen Pfeffer, Angelina Mooseder, Luca Hammer, Oliver Stritzel, and David Garcia. 2022. This Sample seems to be good enough! Assessing Coverage and Temporal Reliability of Twitter’s Academic API. arXiv preprint arXiv:https://arXiv.org/abs/2204.02290 17, 1 (2022), 720–729. [18]Ashwin Rao, Fred Morstatter, Minda Hu, Emily Chen, Keith Burghardt, Emilio Ferrara, and Kristina Lerman. 2021. Political partisanship and antiscience attitudes in online discussions about COVID-19: Twitter content analysis. Journal of medical Internet research 23, 6 (2021), e26692. [19]Sharon Ringel and Roei Davidson. 2022. Proactive ephemerality: How journalists use automated and manual tweet deletion to minimize risk and its consequences for social media as a public archive. new media & society 24, 5 (2022), 1216–1233. [20]Cagri Toraman, Furkan Şahinuç, and Eyup Halit Yilmaz. 2022. BlackLivesMatter 2020: An analysis of deleted and suspended users in Twitter. In 14th ACM Web Science Conference 2022. Association for Computing Machinery, New York, NY, USA, 290–295. [21]Christopher Torres-Lugo, Manita Pote, Alexander C Nwala, and Filippo Menczer. 2022. Manipulating Twitter through Deletions. In Proceedings of the International AAAI Conference on Web and Social Media , Vol. 16. AAAI, Washington, DC 20004, USA, 1029–1039. [22]Mark Warner, Laura Lascau, Anna L Cox, Duncan P Brumby, and Ann Blandford. 2021. “Oops...”: Mobile Message Deletion in Conversation Error and Regret Remediation. In Proceedings of the 2021 CHI Conference on Human Factors in Computing Systems. Association for Computing Machinery, New York, NY, USA, 1–13. [23]Sarita Yardi and Danah Boyd. 2010. Dynamic debates: An analysis of group polarization over time on twitter. Bulletin of science, technology & society 30, 5 (2010), 316–327. [24]Lu Zhou, Wenbo Wang, and Keke Chen. 2016. Tweet properly: Analyzing deleted tweets to understand and identify regrettable ones. In Proceedings of the 25th International Conference on World Wide Web. Association for Computing Machinery, New York, NY, USA, 603–612. [25]Arkaitz Zubiaga. 2018. A longitudinal assessment of the persistence of twitter datasets. Journal of the Association for Information Science and Technology 69, 8 (2018), 974–984.
Do you like what you are reading? Subscribe to receive updates.
Unsubscribe anytime