
Investigating Characteristics, Biases and Evolution of Fact-Checked Claims on the Web
Authors: Susmita Gangopadhyay , Sebastian Schellhammer , Salim Hafid , Danilo Dessi , Christian Koß , Konstantin Todorov , Stefan Dietze , Hajira Jabeen DOI: 10.1145/3648188.3675135
Abstract
Given the recent proliferation of fake news online, fact-checking has emerged as a critical defence against misinformation. Several fact-checking organisations are currently employed in the initiative to assess the truthfulness of online claims. Verified claims serve as foundational data for various cross-domain research, including fields of social science and natural language processing, where they are used to study misinformation and several downstream tasks such as automated fact-verification. However, these fact-checking websites inherently harbour biases, posing challenges for academic endeavours aiming to discern truth from misinformation. In this study, we aim to explore the evolving landscape of online claims verified by multiple fact-checking organisations and analyse the underlying biases of individual fact-checking websites. Leveraging ClaimsKG, the largest available corpus of fact-checked claims, we analyse the temporal evolution of claims, focusing on topics, veracity levels, and entities to offer insights into the complex dimensions of online information. We utilise data and dimensions available from ClaimsKG for our analysis and for dimensions such as topics which are not present in ClaimsKG, we create a topic taxonomy and implement a transformer-based model, for multi-label classification of claims. We also observe how similar claims are co-occurant amongst different websites. Our work serves as a standardised framework for categorising claims sourced from diverse fact-checking organisations, laying the foundation for coherent and interpretable fact-checking datasets. The analysis conducted in this work sheds light on the dynamic landscape of online claims verified by several fact-checking organisations and dives into biases and distributions of several fact-checking websites.
Keywords: Fact-checking , Claims Classification , Claims Analysis , Knowledge Graphs , Mis- and disinformation
1 INTRODUCTION
As internet resources become a primary source of information, understanding its influence becomes pivotal for well-informed decision-making across political, social, and economic spheres. The ease of information accessibility and rapid diffusion of news brings forth both opportunities and challenges. While it facilitates the swift sharing of information, it also fuels the proliferation of misleading or false content [ 47 ]. In response to this, there has been a surge in demand for fact-checking as a line of defence against misinformation, encompassing both manual and automated approaches. Given the cost involved in manual fact-checking and the lack of robust tools for automating that process, already fact-checked claims are a precious resource when aiming to understand information quality. Fact-checked claims play a pivotal role, serving as a cornerstone for various research domains to draw meaningful conclusions about the influence of information on societal dynamics. In the realm of social sciences, verified claims serve as a rich source for analysing online discourse [ 48 ]. By understanding the veracity of claims in online discourse, analysts can track the dissemination of accurate or misleading information and comprehend the dynamics of information sharing within online communities [ 5 ]. In Natural Language Processing (NLP), verified claims serve as a primary source of ongoing research endeavours for automated fact-checking processes [ 23 ].
However, fact-checking websites such as Snopes, Politifact, or Factcheck AFP usually have individual biases as to what kind of claims are deemed check-worthy leading to potential biases concerning prevalent topic distributions, and spatial or temporal coverage. Given that it is a common practice across various research fields to use claims sourced from fact-checking sites, either as training data or as a source of labelled claims when investigating misinformation spread, understanding the inherent biases of different fact-checking sources and the diversity of fact-checked claims overall is an important factor in the field of mis- and disinformation research.
In addition to this, verified claims from different sources employ distinct terminologies, for instance, when assigning topics or veracity labels. Consequently, the compiled data remains heterogeneous, incomplete, and scattered across multiple sources, posing challenges in fully interpreting and understanding claims to generate actionable insights. Furthermore, issues such as the absence of standardised taxonomies for topics and veracity labels exacerbate these challenges. Organising claims into standard topics and veracity labels makes it easier to analyse the diverse and spread-out information found on fact-checking websites.
In this work, we attempt to present an overview of the fact-checked claims landscape over the last two decades and understand biases and distributions in fact-checked claims across various sources. We conduct our study using the latest version of ClaimsKG [ 18 ] [ 44 ], a comprehensive knowledge base of fact-checked claims from 13 sources spanning from 1996 to December 2022. More precisely, our work addresses the following research questions:
RQ0 - How are veracity labels of verified claims distributed across different periods?
RQ1 - How are veracity labels of verified claims distributed across different topics?
RQ2 - How have claims concerning different topics evolved over time?
RQ3 - Do fact-checking websites predominantly focus on specific topics or specific truth value classifications?
RQ4 - How are certain entities distributed within the claims and their reviews?
RQ5 - How are similar claims occurring across different websites?
To answer the research questions mentioned above, our analysis focuses on the following dimensions:
Temporal Aspect . Claims are associated with two dates: the original publication date on (social) media and the review date by fact-checking websites, allowing for an examination of how they evolve across different periods. We extract this dimension from ClaimsKG using the dates associated with claims and their reviews.
Veracity Labels . Fact-checking websites employ a variety of descriptors to communicate the accuracy of claims. The veracity labels assigned to claims are particularly intriguing to researchers, offering insights into the perception biases of fact-checking platforms [ 4 ] and the epistemological aspects [ 46 ] of the fact-checking process. However, veracity labels vary across fact-checking websites. ClaimsKG extracts the heterogeneous and discrete ratings provided by the websites and provides a uniform and normalised veracity label structure along with the claims which we use in our analysis.
Entities . Claims and their reviews contain entity mentions (e.g., people, organisations, locations, dates, etc ) that can be used for a deeper analysis of ongoing discussions on the web. Entities also help in describing the context that helps in understanding the broader landscape of the information ecosystem. We rely on the entities provided as a part of the ClaimsKG dataset for the analysis provided in this work.
Topics . Topics of claims help users to find relevant fact-checked information they are interested in. They hold significant relevance for social scientists to understand inherent biases within fact-checking pages, as they provide crucial insights into the distribution of truth values across different subjects. By analysing the topic distribution, researchers can uncover patterns of disproportionate coverage, which may reflect underlying societal dynamics or editorial inclinations. Organising claims into distinct topics also serves as a valuable tool in enhancing access to information for journalists, social scientists, and citizens alike. Since topics are not a part of ClaimsKG, we present our efforts to create a unified classification schema for claims coming from various fact-checking websites, a transformer-based model to classify claims into the topics of the proposed schema, and an analysis that would not be possible without them.
In summary, our contributions include:
Study of claim evolution and biases of individual fact-checking websites. To the best of our knowledge, we provide the most comprehensive study to date of the characteristics of claims on the Web, exploring dimensions such as temporal aspects, topics, veracity, and text entities yielding insights. Utilising ClaimsKG, we find that the fact-checked claims are predominantly false, with a significant variance across topics and the proportion of false claims has increased substantially over time. In addition, the distribution of fact-checked claims is substantially biased towards certain topics, whereas most fact-checking platforms seem to have their own inherent inclination of what topics to consider check-worthy. Likewise, notable regional biases are evident, with certain fact-check sources displaying strong inclinations toward the US, while others lean toward the UK or other specific regions.
Topic taxonomy and claims classification model. We provide a unified set of topics together with a transformer-based model capable of accurately labelling claims from diverse sources using the proposed taxonomy with an average Macro F1 score of 0.78, with certain classes achieving a maximum score of 0.95.The specific emphasis on topics stems from the fact that this remains an unresolved issue. Building upon the dimensions mentioned earlier (temporal Aspect, veracity labels, and entities), it is evident that the topical dimension requires further efforts toward reconciliation, structuring, classification, and other related tasks since it is not readily available as a part of our dataset.
2 RELATED WORK
Online claims stand as crucial pillars within diverse research fields, serving as foundational elements to derive insightful conclusions about the spread of information. Previous studies have explored interesting areas in this field. Analysis has been done on the spread of true and false news online [ 47 ] and detecting previously fact-checked claims [ 32 , 40 , 41 ]. Some notable surveys [ 8 , 42 ] explored the dissemination and consumption of information within social media, while others have focused on the challenges of “fake news” from a fact-checking standpoint [ 45 ]. Sängerlaub [ 39 ] explored how the challenge of disinformation is exacerbated by the prevalent trend of information being published before thorough verification, and how the integration of automated fact-checking techniques facilitated by machine learning offers a promising solution to this problem. Elaborating more on how verified claims also act as a tool for engineering automated fact-checking systems, some works [ 21 , 23 ] focused on the task formulation, methods, and future directions of automated fact-checking.
Studies have also examined the check-worthiness of claims [ 24 ], investigating claims and assumptions within the social media landscape through the social impact theory [ 34 ]. Amidst the Covid-19 pandemic, investigations into claims have shed light on the “infodemic” [ 2 ], types and sources of Covid-19 related claims [ 10 ] and to combat scientific misinformation [ 43 ]. Others have studied the role of fake claims in political misinformation [ 16 ] and conspiracy theories [ 15 ]. Research has explored the role of fake claims in political misinformation, shedding light on tracking the dissemination of claims to estimate the likelihood of the illusory truth effect [ 22 ]. While some research has addressed claim classification using neural networks [ 20 ], the focus has often been on comments made by users in online arguments, rather than claims collected from fact-checking websites.
Some researchers have undertaken efforts to explore the relationship between claims and topics. For example, Vlad [ 14 ] worked on unsupervised clustering of claims into k clusters, which they call topics and utilised them to train a machine learning model for the detection of fake news. However, their work did not have a fixed number of topics or a specific topic schema. Others have worked on claim detection where a model is trained on claims from certain topics and then recognised check-worthy claims on a new, unseen topic [ 1 ].
The ClaimsKG Statistical Observatory [ 19 ] represents an important initiative that sought to extract and visualise statistics from the ClaimsKG dataset. However, it is noteworthy that their approach differed from ours in several key aspects. Firstly, the Observatory was a user-oriented web application that is currently not accessible online. Secondly, the topics selected by the ClaimsKG Statistical Observatory were based on the keywords associated with each claim, showcasing variances from our chosen topics (albeit with a few commonalities). In contrast to this, our approach offers a standardised vocabulary of topics that remains consistent regardless of changes in claims and their associated keywords. We built this extensive topic taxonomy based on fact-checker-assigned topics. During this work, we surveyed established thesauri like UNESCO 1 , TheSoz 2 , and ELSST 3 and noticed that although some concepts matched our topics, others did not. Moreover, certain thesauri were quite expansive, while others merged disparate topics like "Politics, Law, and Economy" or included categories like "Countries and Country Groupings" which were not helpful for our analysis. Since our data originated from fact-checking websites, our goal was to categorise the claims according to the primary topics designated by the fact-checkers. This approach afforded us annotated data from the start, allowing us to perform model training and a machine learning approach for claims classification, different from the approach mentioned in ClaimsKG Statistical Observatory. In our work, we explore various dimensions such as time, topics, truth values, and entities, all of which were not covered in the ClaimsKG Statistical Observatory providing a more holistic perspective on the dataset. Furthermore, our visualisation outputs in-depth analysis, which is a key aspect that we prioritise in our findings. Our paper addresses these gaps and presents a thorough analysis of the results obtained from our visualisations, enhancing the understanding of online discourse evolution in online claims and fact-checking websites.
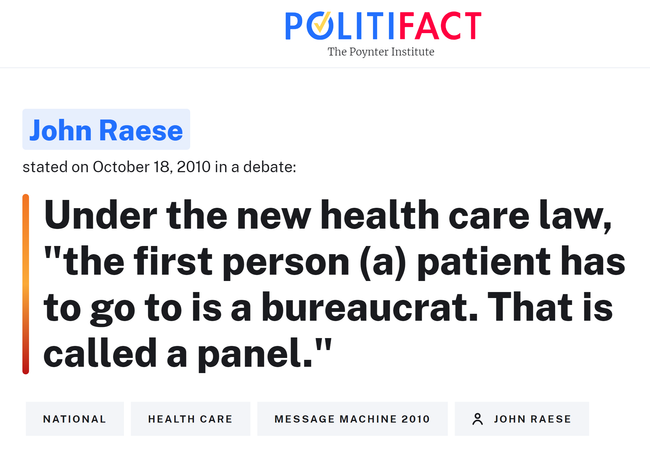
Figure 1: A sample claim that belongs to the topic “Health Care" in PolitiFact.
3 THE DATASET
Our dataset originates from the most recent release of ClaimsKG, titled ClaimsKG - A Knowledge Graph of Fact-Checked Claims (January, 2023) [ 18 ]. It includes a total of 74,066 claims and 72,127 claim reviews sourced from 13 distinct fact-checking websites. These websites feature claims in multiple languages, including English, French, Russian, Urdu, Hindi, Punjabi, Assamese, Tamil, Malayalam, Gujarati, Telegu, Marathi, Odia and Bengali. Our focus is specifically on claims presented in the English language, amounting to 65,121 claims sourced from 7 different websites: PolitiFact, Snopes, Factcheck AFP, Checkyourfact, FullFact , Africacheck , and TruthorFiction . Table 1 shows a detailed breakdown of claim counts per website. We looked inside ClaimsKG to gain a deeper understanding of the dimensions mentioned in Section 1 . The claims present in the data have publication dates and review dates between the years 1996 and 2022. The analysis presented in this paper relies on the claim review date because i) only 43% of the claims included a publication date and ii) the veracity labels were assigned during the review process. Additionally, ClaimsKG provides a standardised set of truth values (e.g., True , False , Mixture , and Other ) 4 , enabling investigations into the distribution of truth ratings across fact-checking sites. We delved into these truth value classifications and their interpretations [ 17 ] to grasp their meanings. A claim receives a True or False label when it is considered completely true or entirely false without any ambiguity in its ratings. Mixture is designated for claims that contain both truth and falsehood, such as “half-true”, “Truth! But Postponed!”, or “misleading”. Other encompasses claims that do not align with the True / False or Mixture categories and has received ratings like “Pending Investigation” or “photo out of context,” among others. Furthermore, the data provides entity annotations of claims and their reviews obtained through the Python Entity Fishing Client, 5 a tool for entity disambiguation against DBpedia. 6 Lastly, it also provides links for each claim to their corresponding fact-checking websites, enabling us to gather information about the topics, (if any) associated with each claim. We used this to collect the topics each claim is associated with. On the collected topics, we observed that:
Not all websites have claims classified into topics. For instance, out of the 7 websites, Checkyourfact does not provide any kind of topics associated with its claims.
The other 6 websites, do not follow a standardised set of topic assignments. Each of these websites uses its own specific vocabulary that is designated by its fact-checkers and applies different labels for the same topic. For instance, “PolitiFact" has a broad topic named “Legal Issues", “Snopes" uses multiple labels like “Law Enforcement," “Legal" and “Legal Affairs" to denote similar concepts, while “FullFact" categorised their claims simply as “Law". Figure 1 shows sample topics occurring across the website PolitiFact and a sample claim belonging to the topic “Health Care”.
This disparity in topics across different sources motivated us to homogenise the topics across the websites and come up with a unified schema for topic classification, as described in Section 4 .
Table 1: Count of Claims collected from each website
Column 1 | Column 2 | Column 3 |
|---|---|---|
Websites | URL | Claims |
PolitiFact | https://Politifact.com | 22,373 |
Snopes | https://snopes.com | 18,818 |
Factcheck AFP | https://factcheck.afp.com | 6,662 |
Checkyourfact | https://checkyourfact.com | 4,878 |
FullFact | https://Fullfact.org | 4,697 |
Africacheck | https://africacheck.org | 4,590 |
TruthorFiction | https://truthorfiction.com | 3,103 |
4 Topic Classification
In this section, we describe the selection and mapping process to create a unique topic taxonomy, followed by fine-tuning a classifier for the classification of claims into the established topics.
4.1 Topic Selection
We analysed each of the 7 websites (listed in Table 1 ) and observed how topics were assigned to their claims. We noticed that amongst all these websites, Checkyourfact does not classify claims according to topics. From the remaining 6 websites PolitiFact , 7 Africacheck , 8 FullFact , 9 Snopes , 10 Truthorfiction , 11 and AFP Factcheck . 12 ,we compiled a list of all prevalent topics and created a list of 401 varied topics. After sifting through this list of topics, we performed the following steps:
We selected the most prominent and frequently occurring topics across all these websites, ensuring that each selected topic was found in at least three of the fact-checking websites. For instance, the topic of “Immigration” appeared consistently across all six websites.
Derived a final list of 21 selected topics present on our GitHub page 13 to which all the others could be mapped.
4.2 Topic Mapping
After finalising the list of 21 topics, our task shifted to labelling the claims according to them. During this process, we observed that out of 401 original topics from the websites, 170 of them were semantically similar to our chosen 21 topics or could be mapped as subtopics. For instance, “Legal Issues" from “PolitiFact”, “Law Enforcement,” “Legal”, and “Legal Affairs” from “Snopes” and “Law” from “FullFact” can be mapped under the umbrella of the Legal Affairs topic chosen by us in the final list. Therefore, we streamlined these varied categorisations and devised a unified mapping that aggregated synonymous or closely related topics under a single unified topic. An excerpt from this mapping schema is presented in Table 2 , and the comprehensive scheme is available on our GitHub repository 14 . Remaining 231 topics were irrelevant or ad hoc, those that could not be mapped to any topic. These consisted of words such as Ask PolitiFact , Ad Watch , Viral Phenomena , Uncategorized , etc. These topics were discarded, and the resulting claims that were labelled with only these topics were added to the set of unlabelled claims. Following this mapping process, we relabelled all the claims into the selected 21 topics, which resulted in 36,902 labelled and 28,219 unlabelled claims. The labelling process also involved assigning multiple labels to an individual claim, allowing claims to belong to more than one topic.
Table 2: Sample mapping schema for topic “Immigration"
Similar topics from different websites | Mapped topic | |||||||||||||
|---|---|---|---|---|---|---|---|---|---|---|---|---|---|---|
immigration, EU immigration, immigrants and crime, immigration statistics, immigration and integration, immigration and jobs, public opinion of immigration, immigration and public services, treatment of immigrants, asylum seekers and refugees, immigration and the NHS, border control, refugees, Canadian immigration | immigration, | EU immigration, | immigrants and crime, | immigration statistics, | immigration and integration, | immigration and jobs, | public opinion of immigration, | immigration and public services, | treatment of immigrants, | asylum seekers and refugees, | immigration and the NHS, | border control, refugees, | Canadian immigration | Immigration |
immigration, | ||||||||||||||
EU immigration, | ||||||||||||||
immigrants and crime, | ||||||||||||||
immigration statistics, | ||||||||||||||
immigration and integration, | ||||||||||||||
immigration and jobs, | ||||||||||||||
public opinion of immigration, | ||||||||||||||
immigration and public services, | ||||||||||||||
treatment of immigrants, | ||||||||||||||
asylum seekers and refugees, | ||||||||||||||
immigration and the NHS, | ||||||||||||||
border control, refugees, | ||||||||||||||
Canadian immigration |
4.3 Model Selection and Training
After creating a collection of labelled claims aligned with our manually crafted set of topics, we proceeded to fine-tune a classifier using these topics to be able to classify the remaining unlabelled claims. Since online claims can be associated with more than one topic, thus the proposed model aims at solving a multi-class multi-label classification problem. In detail, given a claim c and the set of potential topics T = { t 1 , …, t n } we want to create a model ϕ ( c ) → T ′| T ′⊆ T . We performed our experiments on a pre-trained RoBERTa-BASE [ 30 ] model. It is a pretrained model on the English language, trained for a masked language modelling (MLM) [ 36 ] objective. We chose to use Asymmetric Loss ("ASL") [ 7 ] to measure the model's performance. This distinctive loss function operates uniquely on positive and negative samples, dynamically adjusting weights for easy negative samples and applying hard thresholds. This aids in discarding potentially mislabelled samples. We adopted a 5-fold cross-validation method for the fine-tuning. This involved random shuffling of the training dataset into 5 subsets, where 4 subsets were utilised for training while 1 subset was reserved for testing the model's performance. This process was iterated five times, creating five distinct models, each trained over ten epochs. This fine-tuning setting was applied to the total 36,902 labelled claims that consisted of the training data after the mapping process as previously described in section 4.2 . The model that performed the best in terms of macro F1 score was chosen as our classifier.
4.4 Inference
We observed promising classification results 15 across all topics within the 5-fold dataset. These results represent the average performance of five different models across the fifth subset reserved for testing (as described in Section 4.3 ). Results showed an average Micro F1 score of 0.80 and Macro F1 score of 0.74. For classes such as Covid, Economy, Immigration, and Health, scores were higher than 0.85 as F1 score, having achieved a maximum of 0.91 in some cases. Having achieved satisfactory performance from the classifier, we selected the model with the highest F1 macro score to classify the 28,219 unlabelled claims. In addition to the unlabelled claims, we extended the application of the classifier to the already labelled 36,902 claims sourced from fact-checking websites. This step was motivated by our observation that claims labelled by fact-checkers may not comprehensively capture the content of the claims, resulting in incomplete labels. For example, Figure 1 illustrates a claim from PolitiFact categorised under the issue "Health Care." The claim should ideally cover labels such as Legal Affairs or Politics , considering its references to “health care law” and “bureaucrats”. These nuanced aspects are often overlooked by fact-checkers. Recognising the incompleteness of fact-checker-assigned labels, we deemed it crucial to leverage data labelled and classified by the same classifier for our analysis. In the end, we compiled a list of 65,121 claims that had been assigned labels by the classifier that are used in the analysis presented in the next sections. The complete list of claims classified according to topics is made available. 16
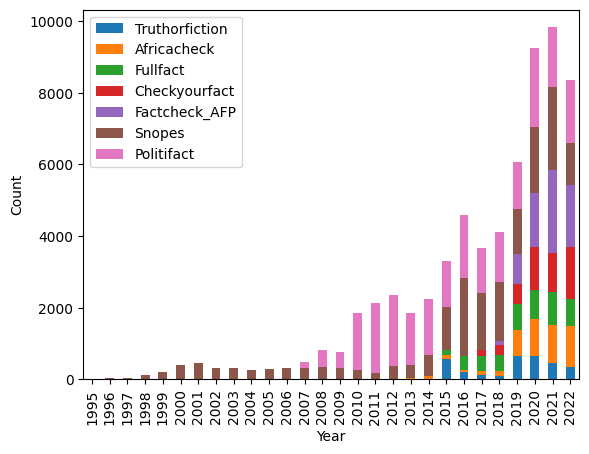
Figure 2: Count of claims from different sources
5 VERACITY, TOPICS, ENTITIES, CO-OCCURRENCES AND DISTRIBUTION OF CLAIMS
In this section, we address the research questions formulated in Section 1 with various dimensions of analysis and the claims labelled with our classifier. We delve into the evolution of claims using the web fragment represented by the ClaimsKG dataset spanning from 1995 to December 2022.
5.1 RQ0: Distribution of Veracity Labels over Different Periods
We plot the distribution of 65,121 claims over the years in Figure 2 and their veracity labels in Figure 3 . We notice that:
During 1995, Snopes reported a very small number of claims, and all of them were False .
Throughout the years, the reported percentage of False claims consistently outweighs that of True claims.
During the peak year in 2021, approximately 65% of the total claims reported were found to be False .
Over time, there has been a notable rise in the proportion of False claims. This is confirmed by studies in social science that suggest False claims have gained a different functional use in mass media serving as a political instrument, e.g., during the 2016 US presidential elections [ 3 ] [ 11 ] and German Parliament [ 26 ]. This evolution has led to a surge in their frequency and relevance in contemporary discourse.
In 2007, there was a notable surge in the number of Mixed claims. However, upon closer examination, it was revealed that the rise was due to the influx of claims from PolitiFact website which came into operation that year. Incidentally most claims from PolitiFact during that time were labelled as “half false" and “mostly true," leading to the observed rise in the category of Mixed claims during that period.
We also observe the ratio of Mixed and Other labels have declined after 2013. This trend suggests that fact-checker assessments have inclined toward a more definitive truth rating rather than maintaining an ambiguous stance. The reason behind this might be purely editorial because conclusive fact-checked claims tend to be shared more than others [ 28 ]. However, the ratio of True claims has remained consistently lower than False claims throughout the entire period. Figure 3: Distribution of claims and their veracity labels over time.
5.2 RQ1: Distribution of Veracity Labels across Topics
Analysing the allocation of topics to claims, as shown in Figure 4 , reveals a significant trend in veracity distribution. Across various topics, we discovered that False claims dominate, except for Business, Economy, and Education, where there is a noticeable prevalence of claims with Mixed truth values signifying that they are not entirely True or entirely False . COVID-related claims stand out with the highest percentage of falsehoods, approximately 71%. The widespread propagation of false claims about COVID and more in general about Health highlights the significance of studying misinformation and delving into the dynamics of its dissemination on the Internet as already investigated in previous studies [ 12 ]. For instance, misinformation and fact-checking efforts related to COVID have helped reinforce truthfulness in the news media, contributing positively to democracy [ 31 ]. Following closely are topics such as Military (67%), Elections (nearly 63%), and Religion (around 56%) all marked by a significant prevalence of False claims. By examining this distribution, researchers and policymakers can better prioritise resources and interventions to combat misinformation and promote accurate information spread across diverse areas of interest. For example, false claims about the military may arise due to propaganda efforts or attempts to influence public opinion on matters of national security [ 35 ], whereas claims about politics may be used for countervailing political statements and enhance factual knowledge during elections [ 6 ].
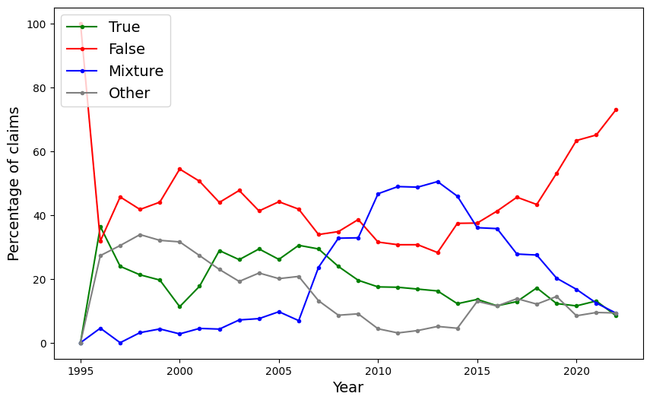
Figure 3: Distribution of claims and their veracity labels over time.
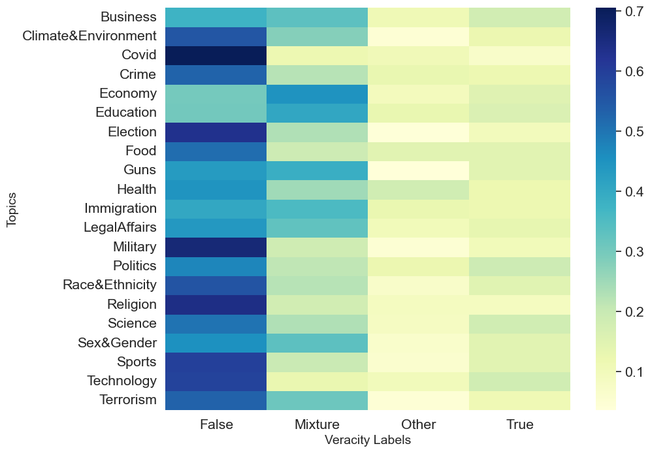
Figure 4: Percentage of each Veracity Label for each Topic
5.3 RQ2: Frequency of Fact Checks across Topics
The surge of claims from 2019 to 2022 in Figure 2 intrigued us, leading to an exploration of prevalent topics within these claims. During this time frame, we have noticed an increase in the prevalence of certain topics that were not as prominent previously (Figure 5 ). For instance, topics such as COVID, Race&Ethnicity, Sports, Military, and Elections have gained significant dominance and visibility. Certainly, all these occurrences could be correlated with global events during those years. Out of all COVID-related claims, about 43% of them occurred in 2020 and 36% in 2021 (Figure 5 ). Undoubtedly this was due to the global pandemic that broke out in the year 2019 and we noticed a huge number of claims related to COVID during that time(Figure 6 ). We also noticed a small proportion of claims have been labelled as “COVID” in Figure 5 before COVID emerged in 2019. Upon inspecting these claims, we observed that the classifier has associated patterns related to the H1N1 virus, swine flu, and mask-wearing behaviour with COVID. In 2020, Election and Race/Ethnicity gained significance. A closer look reveals that all the websites focused on US presidential Elections and the George Floyd Protests during that time. Sports emerged in 2021, followed by a significant rise in the topic of Military in 2022 predominantly associated with the Russia-Ukraine war. For example, a false claim from Checkyourfact says “A video shared on Facebook claims Russian President Vladimir Putin declared war on Kenya” . However, examining the entire timeline from 1996 to 2022 (as depicted in Figure 6 ), Politics consistently stood as the most prevalent topic across all websites. Other significant subjects like Economy, Technology, Health, and Crime followed suit throughout this extensive period.
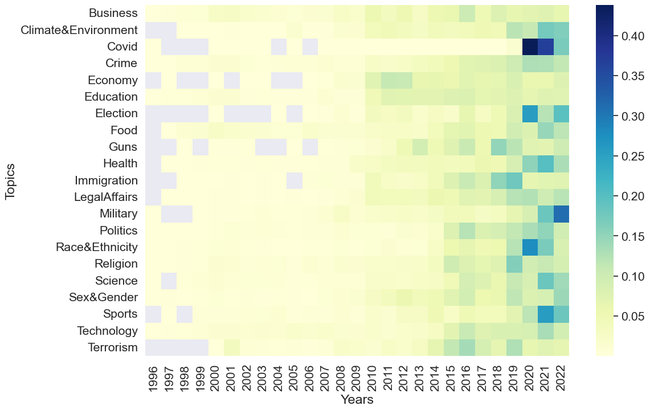
Figure 5: Coverage of each topic over the entire time period. For each topic, the reader can observe the percentage of claims occurring per year across all websites. The darker the colour the higher the percentage.
The observation of a rise in sports-related claims in 2021, despite the absence of a particular defining event, is intriguing. The identified surge seems to be attributed to a collective series of events associated with Basketball, the India-Australia cricket series, the UEFA European Championship and the Tokyo Olympics. It is noteworthy that this surge occurred after a two-year pause imposed by the global pandemic. This phenomenon could be indicative of the gradual return to normalcy in the world of sports after the pandemic-induced disruptions. The resumption of major sports events and activities might have stimulated increased public attention and discussion, resulting in a corresponding surge in claims related to these events. This observation not only reflects the close relationship between societal events and claim dynamics but also highlights the potential impact of global circumstances on spread of facts [ 13 , 29 ].
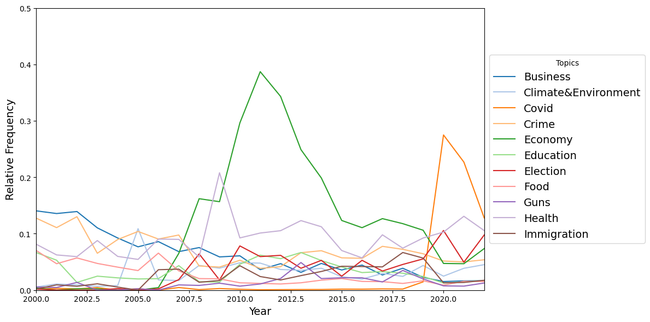
Figure 6: Relative appearance of each topic per year. For each year, the relative proportion of claims adhering to a specific topic across all fact-check sources is shown.
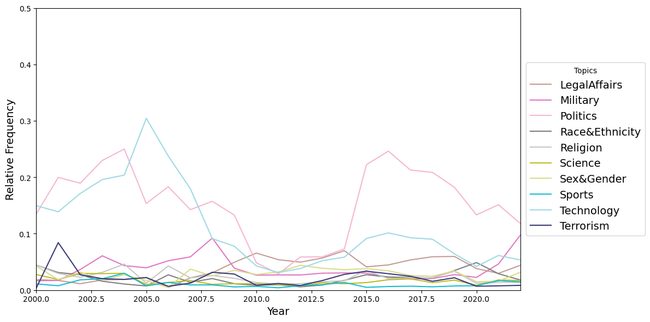
Figure 7: Topic distribution across key fact-check sources
We also analyse the evolving dynamics of topics over time, revealing intriguing patterns aligned with real-world events. We notice a spike in claims associated with Economy in 2008 which continued till years 2011-2012 as seen in Figure 6 . During this period, the discourse predominantly centred around the aftermath of the 2008 Economic Crisis and persisted for several subsequent years. For example, a claim by PolitiFact in 2008 asserted that “On the economic crisis, the biggest problem in this whole process was the deregulation of the financial system.” highlighting the economic crisis. Topics also included discussions on state budgets and US military spending. In 2011 and 2012, claims still referenced issues like inflation, unemployment, and the ramifications of the economic crisis, particularly during President Barack Obama's tenure. For instance, a 2012 PolitiFact claim stated that “RNC Chair Reince Priebus says the U.S. has lost 26 million jobs under Barack Obama,” while another claim in 2012 noted that “The U.S. unemployment rate has remained above 8 percent for 43 consecutive months, the longest stretch since the Great Depression” . Snopes and PolitiFact emerged as the primary fact-checking sources during this period. While Snopes addressed a wider range of claims, PolitiFact predominantly focused on claims related to the economy from 2008 to 2012. We looked at the spike in Terrorism-related claims during 2001 (Figure 6 ). Analysing the surge revealed a prevalent focus on the 9/11 attacks and prominent terrorist group leaders. Some of the example claims during that period are “World Trade Center attack survivor Adam Mayblum gave a first-person account of his harrowing escape from one of the doomed towers.” and “Osama bin Laden owns extensive gum arabic holdings” .
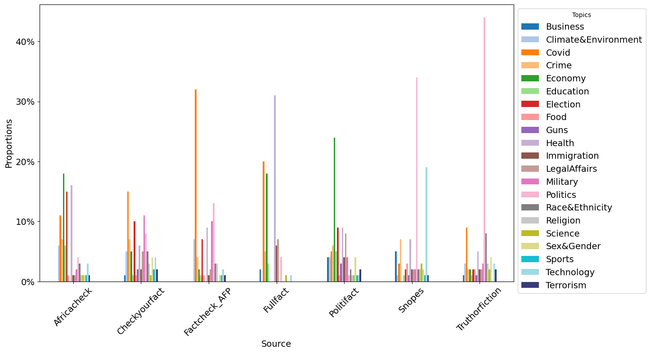
Figure 8: Veracity Label distribution from various sources
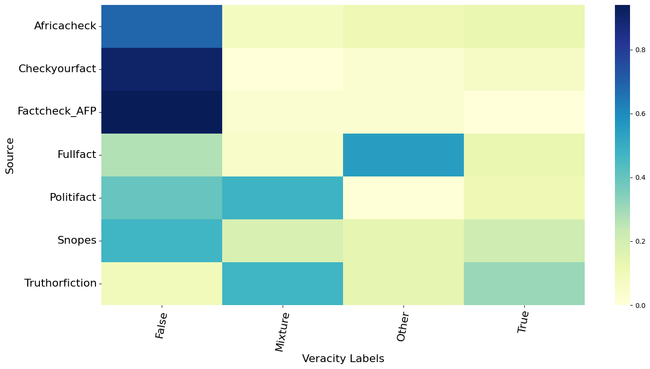
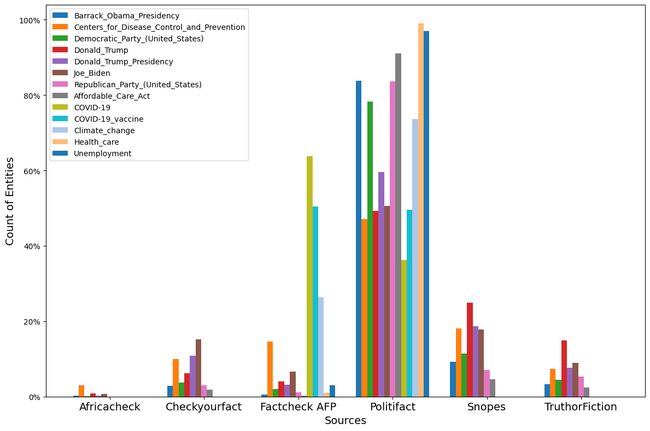
Figure 9: Frequently occurring entities across each website
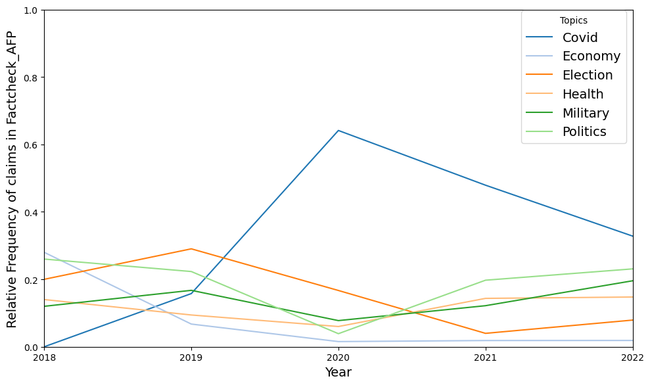
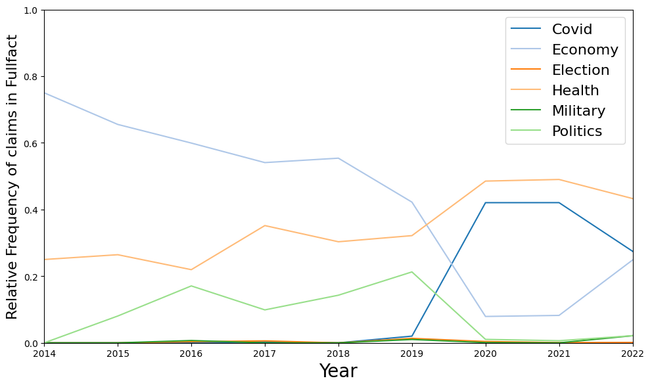
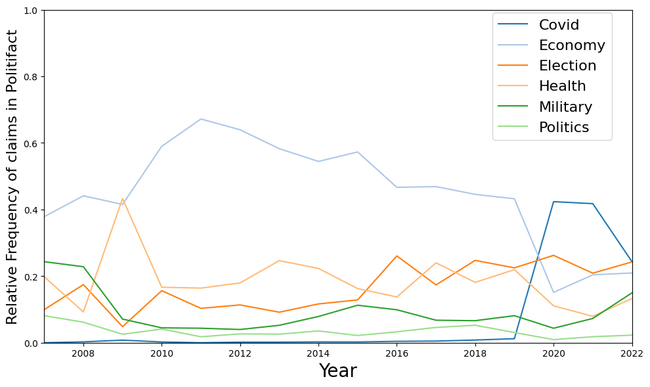
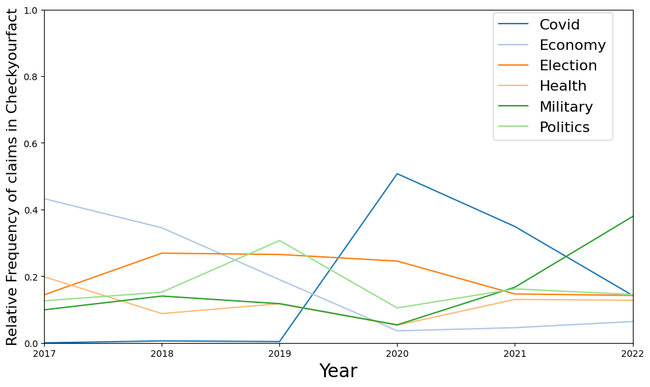
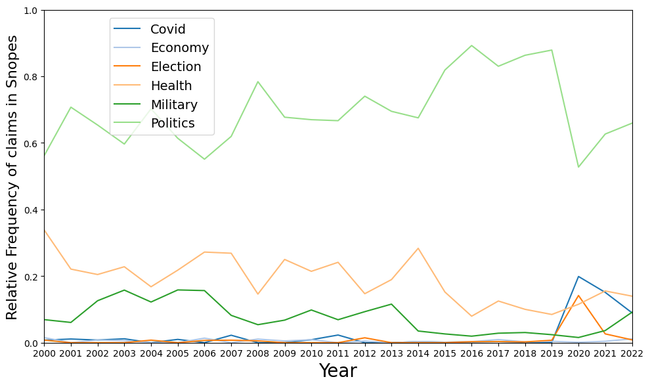
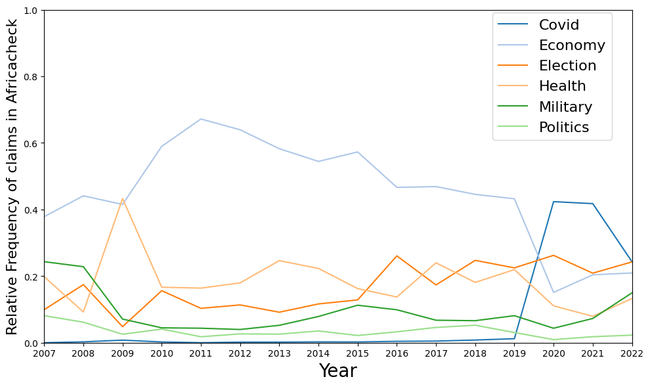
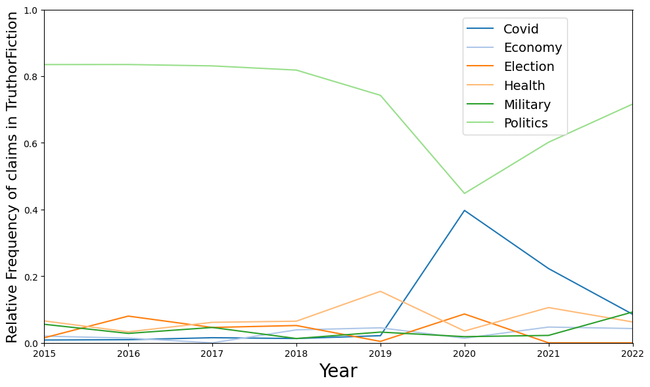
Figure 10: Distribution of six prominent topics across each fact-checking source (a) Factcheck AFP, (b) PolitiFact, (c) FullFact, (d)Snopes, (e) Checkyourfact, (f) Africacheck, (g) TruthorFiction
We performed a deeper analysis of some of the prominent topics and how individual websites focused on them in Figure 10 . We observed that websites like Factcheck AFP, Checkyourfact, PolitiFact, and Africacheck shifted their focus from other topics to verifying more claims related to COVID during 2019. Similarly, during 2022, platforms like Africacheck notably pivoted their attention towards Election (Figure 10 ) due to events such as the Nigerian elections and the economic landscape across the African subcontinent. By examining claims through the lens of various topics, we could uncover patterns, generate insights into global events, and shed light on issues that are not only significant but also warrant further investigation.
5.4 RQ3: Fact Checking Sources, Topics,& Veracity Labels
Following our examination of claims based on topics and truth values, we aimed to explore the origins of these claims and their distributions across different sources. We observed in Figure 7 that various sources have different focal points in their topics. For instance, Snopes and TruthorFiction tend to emphasise politics, FullFact leaned toward health topics, and Factcheck AFP primarily focused on COVID related subjects in recent years. For the other websites, topics seem to be distributed evenly without any notable emphasis on specific subjects. We also analysed the predominant truth values occurring in each of these sources in Figure 8 . Checkyourfact and FactcheckAFP reports a relatively higher number of False claims followed by Africacheck and Snopes. TruthorFiction is the only website reporting more True claims than False claims. PolitiFact has the highest proportion of Mixed claims and FullFact reported the maximum number of claims that fell into Others category. The varied focus of different fact-checking websites on distinct topics and veracity labels can be attributed to the diverse editorial inclinations of the fact-checkers themselves [ 33 ] [ 27 ]. These inclinations are influenced by their inherent biases toward what they perceive as check worthy [ 9 ] [ 25 ].
5.5 RQ4: Prominent Entities in Claims & Reviews
We further expanded our analysis by examining the most frequently occurring DBpedia entities within both the claims and their respective reviews. The reader can observe this analysis in Figure 9 . 17 Interestingly, a substantial proportion of these entities were references to social media platforms like Facebook, and Twitter, often indicating the claim's origin. Additionally, we observed a prevalence of country and place names like the United States, Texas, and Florida among these entities. We have graphed the top 100 entities across various sources excluding social media, news channels, and names of places, and observed that most originate from PolitiFact. This prominence on PolitiFact's end likely stems from its high volume of claims and included entities like PresidencyofDonaldTrump, PresidencyofBarackObama AffordableCareAct, ClimateChange, Covid19, and Unemployment to name a few. Apart from PolitiFact, Factcheck AFP emerged as another significant platform that contributed more to COVID-related claims compared to others. As illustrated in Figure 7 , AFP Factcheck notably concentrated on COVID-related claims in recent years. We also looked at some of the similar and repetitive entities that have emerged in our analysis. For example, Covid19 and COVID-19vaccine or DonaldTrump and PresidencyofDonaldTrump. We have noted that despite their apparent similarities, these entities are extracted within distinct contexts. “Covid-19” entity is extracted for only Covid-related claims. For example “No, UK's Boris Johnson didn't say Covid-19 pandemic was a lie – fake BBC headline" whereas “Covid-19vaccine” for claims specific to vaccine safety like “...Regulatory Agency (MHRA) has been shared on social media, and asks people to report any side effects from Covid-19 vaccines”. The same holds for discussions about Donald Trump and his Presidency, where one focuses on Donald Trump as a person with no clear indication of his role as U.S. president, while the other delves into his presidency and elections. These entities provide insight into how seemingly similar claims pertain to different contexts and overlapping topics.
Table 3: Key entities identified within each website from inception until December 2022
Column 1 | Column 2 | Column 3 | Column 4 | Column 5 |
|---|---|---|---|---|
Website | DBPedia Entities | |||
Africacheck | ConfidenceTrick, Beware(EP), WilliamRuto, Covid19,Scam(album) | |||
Checkyourfact | COVID-19vaccine,COVID-19pandemic,COVID-19, DonaldTrump, DemocraticParty(UnitedStates), JoeBiden,PresidencyofDonaldTrump, RepublicanParty(UnitedStates), | COVID-19vaccine,COVID-19pandemic,COVID-19, DonaldTrump, | DemocraticParty(UnitedStates), JoeBiden,PresidencyofDonaldTrump, | RepublicanParty(UnitedStates), |
COVID-19vaccine,COVID-19pandemic,COVID-19, DonaldTrump, | ||||
DemocraticParty(UnitedStates), JoeBiden,PresidencyofDonaldTrump, | ||||
RepublicanParty(UnitedStates), | ||||
Factcheck AFP | COVID-19,Covid-19vaccine,ImageComics, Photo(Frenchmagazine), COVID-19pandemic | COVID-19,Covid-19vaccine,ImageComics, Photo(Frenchmagazine), | COVID-19pandemic | |
COVID-19,Covid-19vaccine,ImageComics, Photo(Frenchmagazine), | ||||
COVID-19pandemic | ||||
FullFact | NationalHealthService,Covid-19vaccine,Vaccine, Covid-19, LabourParty(UK),EuropeanUnion, ConservativeParty(UK) | NationalHealthService,Covid-19vaccine,Vaccine, Covid-19, | LabourParty(UK),EuropeanUnion, ConservativeParty(UK) | |
NationalHealthService,Covid-19vaccine,Vaccine, Covid-19, | ||||
LabourParty(UK),EuropeanUnion, ConservativeParty(UK) | ||||
PolitiFact | DonaldTrump, DemocraticParty(UnitedStates), JoeBiden, BarrackObama, RepublicanParty(UnitedStates), AffordableCareAct, UnitedStatesSenate, Unemployment, Tax, Taxpayer HealthCare | DonaldTrump, DemocraticParty(UnitedStates), JoeBiden, BarrackObama, | RepublicanParty(UnitedStates), AffordableCareAct, UnitedStatesSenate, | Unemployment, Tax, Taxpayer HealthCare |
DonaldTrump, DemocraticParty(UnitedStates), JoeBiden, BarrackObama, | ||||
RepublicanParty(UnitedStates), AffordableCareAct, UnitedStatesSenate, | ||||
Unemployment, Tax, Taxpayer HealthCare | ||||
Snopes | DonaldTrump, DemocraticParty(UnitedStates), JoeBiden, BarrackObama, RepublicanParty(UnitedStates), Email,Photographs(Mest album) | DonaldTrump, DemocraticParty(UnitedStates), JoeBiden, BarrackObama, | RepublicanParty(UnitedStates), Email,Photographs(Mest album) | |
DonaldTrump, DemocraticParty(UnitedStates), JoeBiden, BarrackObama, | ||||
RepublicanParty(UnitedStates), Email,Photographs(Mest album) | ||||
TruthorFiction | DonaldTrump, DemocraticParty(UnitedStates), JoeBiden, BarrackObama, RepublicanParty(UnitedStates), | DonaldTrump, DemocraticParty(UnitedStates), JoeBiden, BarrackObama, | RepublicanParty(UnitedStates), | |
DonaldTrump, DemocraticParty(UnitedStates), JoeBiden, BarrackObama, | ||||
RepublicanParty(UnitedStates), |
5.5.1 Entities and Topics: What insights do they offer?. We delved into exploring the correlation between entities and topics by examining the top 30 entities associated with claims on each website. The objective was to ascertain whether the prevalence of notable named entities within claims could offer insights into the dominant topics. Our findings revealed a connection between entities and prominent topics across various websites.
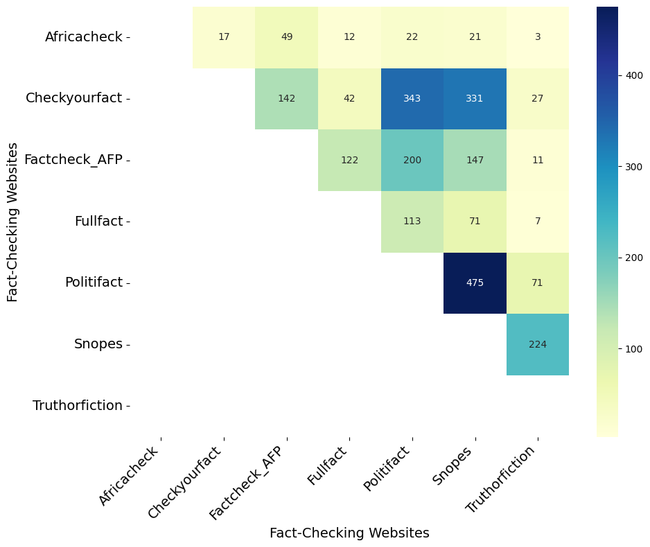
Figure 11: Overlap Counts of Similar Claims between Fact-Checking Websites
For instance, scrutiny of entities in Table 3 and Figure 7 allows us to infer that Fullfact extensively covers Health and Covid-related topics. This inference is drawn from the presence of entities such as NationalHealthService, Vaccine, and Covid-19. Also it is more focused on UK politics, being an independent fact-checking organisation from the UK. On the other hand, Snopes predominantly focuses on Politics, evident from the high occurrence of entities like DemocraticParty(UnitedStates) and RepublicanParty(UnitedStates). Additionally, it shows a keen interest in Technology, as reflected by entities like Email and Photographs(MestAlbum), predicted as technology by the classifier. The examination of entities across various websites, such as Factcheck AFP emphasizing COVID-related topics, TruthorFiction focusing on Politics, and Politifact delving into the Economy through entities like Unemployment and Tax, offers insightful observations. This analysis establishes a clear correlation between entities and the prevalent topics covered by each fact-checking website.
5.6 Similar Claims and their Co-Occurrences
A certain number of identical claims is present within the websites, published on different dates, and reviews. For instance, the same claim was fact-checked by different websites and assigned a rating by their fact-checkers. We investigated the presence of these claims within the dataset and identified 2,450 instances out of a total of 61,151 claims. We used a sentence transformer model [ 38 ] where the sentences with similar meanings are associated with embeddings that are close in the vector space. We used this model to compute an embedding for each sentence. Then, the semantic textual similarity between two sentences is computed, and we have sentence pairs annotated together with a score indicating the similarity between them. The model uses a Siamese network structure that was trained using CosineSimilarityLoss[ 37 ]. We chose the similarity threshold of 0.85, to ensure that only highly similar items are considered matches, and to reduce the likelihood of false positives. We also did a manual check and found that the sentences below this threshold were dissimilar in meaning. While the subset of 2,450 claims is relatively small to discern any clear pattern, it provides a glimpse into prevalent trends and themes within the fact-checking domain.In our analysis of the 2,450 claims, we found that 6.8% of Snopes fact-checked claims are similar to claims in other fact-check sources while 5.4% of the claims verified by Politifact are similar to claims in other fact-check sources The analysis also pointed out certain pairs of websites that have numerous similar facts. For example, Politifact and Snopes have the highest number of similar co-occurrent claims followed by Politifact and Checkyourfact, and Snopes and Checkyourfact. A breakdown of overlapping claims between specific websites is highlighted in Figure 11 Snopes emerged as the most authoritative fact-checker, often being the first to verify similar claims, and sometimes fact-checking claims even 15 years before other websites. Among the claims that Snopes fact-checked and are similar to those in other fact-check sources, Snopes was the first to fact-check 71% of them before any other website. Politics and COVID emerged as the most prevalent topic within the dataset, followed by Health. Notably, the year 2020 witnessed the highest level of overlap, with 497 claims undergoing fact-checking, primarily revolving around COVID and Health-related issues due to the spread of the pandemic and most websites shifting their focus to COVID related claims as seen in Figure 10 .
In our examination of veracity labels, we observed that 50% of these co-occurrant claims were false. We also found a remarkable consistency among various fact-checking platforms. While differences existed in the terminology used for labelling, such as "True" by Snopes and PolitiFact versus "Correct Attribution" by TruthorFiction, there were no conflicting assessments. We did not encounter any instances where a claim was deemed true by one website while being considered false by another. This agreement in fact-checkers stances reinforces the confidence in the reliability and accuracy of their assessments.
6 CONCLUSION
The analysis conducted in this work sheds light on the distributions and biases in fact-checked claims across various sources. In this work, we introduced a unified topic schema for categorising claims sourced from varied fact-checking websites. Leveraging advanced transformer models, we have used a state-of-the-art approach for multi-label classification of claims, aligning with prevalent topics identified across these platforms. While the performance of our classifier may not be considered groundbreaking in pushing the boundaries of the computer science field, the observed correlation with real events and the analysis of entities within claims for each topic suggest a step forward in better understanding the fact-checking landscape and further study of misinformation spread. Our analysis has offered an exploration of online claims from diverse perspectives, including temporal aspects, topics, veracity, named entities, and co-occurant claims, yielding certain valuable insights. Most importantly, we show that different fact-checking sources have very particular topic biases, e.g. being more focused on either economics or politics (Figure 10 ), that vary over time. Similarly, strong regional biases surfaced, where some fact-checking sources seem to be strongly biased towards the US, others to the UK or different regions (Table 3 ). Our findings highlight that specific topics tend to align with particular veracity labels, that certain entities are predominantly used by certain, distinct fact-checking sources and how categorising claims into topics aids in deeper analysis, offering correlations with real-life events. Additionally, we note that certain websites emerge as particularly authoritative fact-checkers, often verifying claims before other platforms, and that the fact-checkers or journalist community were unified and consistent in their assessments towards verifying claims.
Although our analysis is based on ClaimsKG, which only captures a small portion of the vast array of claims circulating and discussed online, this can still have substantial implications for any research into misinformation or fake news relying on single fact-checking website as representative sources of fact-checked claims.
Future work will involve the improvement of the topic assignment. For example, the labelling of claims related to COVID before it emerged in 2019 as observed in Figure 6 ’ could be addressed with further refinement and fine-tuning. There is a substantial number of claims that are labelled as Other and Mixed within our data. These are claims with unclear veracity labels like “uncategorised” and “sarcasm” by the fact-checkers, which do not add valuable insights to our analysis. Investigating these further and establishing distinct truth values for these labels would significantly enhance the analysis of our data. In the future, our plans include expanding the list of topics to achieve greater analysis granularity, encompassing a comprehensive spectrum of topics and subtopics. Additionally, we aim to annually analyse truth value variations for each topic and explore leveraging entities for claim classification into topics. Furthermore, we intend to utilise the multilingual nature of ClaimsKG to classify claims in regional languages and languages other than English. We also aspire to harness the prowess of Large Language Models to annotate and fine-tune our data, allowing for more accurate assessments of claims. This approach holds promise in fortifying the depth and accuracy of our analysis and in generating robust insights into the dynamics of information dissemination.
ACKNOWLEDGMENTS
This work is partially supported by the AI4Sci grant, co-funded by MESRI (France, grant UM-211745), BMBF (Germany, grant 01IS21086), and the French National Research Agency (ANR).
REFERENCES
Amani S Abumansour and Arkaitz Zubiaga. 2023. Check-worthy claim detection across topics for automated fact-checking. PeerJ Computer Science 9 (2023), e1365.
Firoj Alam, Fahim Dalvi, Shaden Shaar, Nadir Durrani, Hamdy Mubarak, Alex Nikolov, Giovanni Da San Martino, Ahmed Abdelali, Hassan Sajjad, Kareem Darwish, et al. 2021. Fighting the COVID-19 infodemic in social media: a holistic perspective and a call to arms. In Proceedings of the International AAAI Conference on Web and Social Media , Vol. 15. 913–922.
Hunt Allcott and Matthew Gentzkow. 2017. Social media and fake news in the 2016 election. Journal of economic perspectives 31, 2 (2017), 211–236.
Mahmoudreza Babaei, Juhi Kulshrestha, Abhijnan Chakraborty, Elissa M. Redmiles, Meeyoung Cha, and Krishna P. Gummadi. 2022. Analyzing Biases in Perception of Truth in News Stories and Their Implications for Fact Checking. IEEE Transactions on Computational Social Systems 9, 3 (2022), 839–850. https://doi.org/10.1109/TCSS.2021.3096038
Ingrid Bachmann and Sebastián Valenzuela. 2023. Studying the Downstream Effects of Fact-Checking on Social Media: Experiments on Correction Formats, Belief Accuracy, and Media Trust. Social Media + Society 9 (06 2023). https://doi.org/10.1177/20563051231179694
Oscar Barrera, Sergei Guriev, Emeric Henry, and Ekaterina Zhuravskaya. 2020. Facts, alternative facts, and fact checking in times of post-truth politics. Journal of Public Economics 182 (2020), 104123. https://doi.org/10.1016/j.jpubeco.2019.104123
Emanuel Ben-Baruch, Tal Ridnik, Nadav Zamir, Asaf Noy, Itamar Friedman, Matan Protter, and Lihi Zelnik-Manor. 2020. Asymmetric Loss For Multi-Label Classification. arxiv: 2009.14119 [cs.CV]
Katarina Boland, Pavlos Fafalios, Andon Tchechmedjiev, Stefan Dietze, and Konstantin Todorov. 2022. Beyond facts–a survey and conceptualisation of claims in online discourse analysis. Semantic Web 13, 5 (2022), 793–827.
Petter Bae Brandtzaeg, Asbjørn Følstad, and María Ángeles Chaparro Domínguez. 2018. How journalists and social media users perceive online fact-checking and verification services. Journalism practice 12, 9 (2018), 1109–1129.
J Scott Brennen, Felix M Simon, Philip N Howard, and Rasmus Kleis Nielsen. 2020. Types, sources, and claims of COVID-19 misinformation . Ph. D. Dissertation. University of Oxford.
Ceren Budak. 2019. What happened? the spread of fake news publisher content during the 2016 us presidential election. In The World Wide Web Conference . 139–150.
Jose Yunam Cuan-Baltazar, Maria José Muñoz-Perez, Carolina Robledo-Vega, Maria Fernanda Pérez-Zepeda, and Elena Soto-Vega. 2020. Misinformation of COVID-19 on the internet: infodemiology study. JMIR public health and surveillance 6, 2 (2020), e18444.
Weihui Dai, Hongzhi Hu, Tunan Wu, Yonghui Dai, et al. 2014. Information spread of emergency events: path searching on social networks. The Scientific World Journal 2014 (2014).
Vlad Cristian Dumitru and Traian Rebedea. 2021. Topic-based Models with Fact Checking for Fake News Identification.. In RoCHI . 182–190.
Adam M Enders and Joseph E Uscinski. 2021. Are misinformation, antiscientific claims, and conspiracy theories for political extremists? Group Processes & Intergroup Relations 24, 4 (2021), 583–605.
Melanie Freeze, Mary Baumgartner, Peter Bruno, Jacob R Gunderson, Joshua Olin, Morgan Quinn Ross, and Justine Szafran. 2021. Fake claims of fake news: Political misinformation, warnings, and the tainted truth effect. Political behavior 43 (2021), 1433–1465.
Susmita Gangopadhyay, Katarina Boland, Danilo Dessí, Stefan Dietze, Pavlos Fafalios, Andon Tchechmedjiev, Konstantin Todorov, and Hajira Jabeen. 2023. Truth or dare: Investigating claims truthfulness with claimskg. In D2R2’23-Second International Workshop on Linked Data-driven Resilience Research , Vol. 3401.
Susmita Gangopadhyay, Sebastian Schellhammer, Katarina Boland, et al. 2023. ClaimsKG - A Knowledge Graph of Fact-Checked Claims (January, 2023). GESIS - Leibniz Institut für Sozialwissenschaften. Datenfile Version 2.0.0, https://doi.org/10.7802/2620 . https://doi.org/10.7802/2620
Malo Gasquet, Darlene Brechtel, Matthaus Zloch, Andon Tchechmedjiev, Katarina Boland, Pavlos Fafalios, Stefan Dietze, and Konstantin Todorov. 2019. Exploring fact-checked claims and their descriptive statistics. In ISWC 2019 Satellite Tracks-18th International Semantic Web Conference .
Chinnappa Guggilla, Tristan Miller, and Iryna Gurevych. 2016. CNN- and LSTM-based Claim Classification in Online User Comments. In Proceedings of COLING 2016, the 26th International Conference on Computational Linguistics: Technical Papers . The COLING 2016 Organizing Committee, 2740–2751.
Zhijiang Guo, Michael Schlichtkrull, and Andreas Vlachos. 2022. A survey on automated fact-checking. Transactions of the Association for Computational Linguistics 10 (2022), 178–206.
Aumyo Hassan and Sarah J Barber. 2021. The effects of repetition frequency on the illusory truth effect. Cognitive research: principles and implications 6, 1 (2021), 1–12.
Naeemul Hassan, Bill Adair, James T Hamilton, Chengkai Li, Mark Tremayne, Jun Yang, and Cong Yu. 2015. The quest to automate fact-checking. In Proceedings of the 2015 computation+ journalism symposium. Citeseer.
Naeemul Hassan, Fatma Arslan, Chengkai Li, and Mark Tremayne. 2017. Toward automated fact-checking: Detecting check-worthy factual claims by claimbuster. In Proceedings of the 23rd ACM SIGKDD international conference on knowledge discovery and data mining . 1803–1812.
Marju Himma-Kadakas and Indrek Ojamets. 2022. Debunking false information: investigating journalists’ fact-checking skills. Digital journalism 10, 5 (2022), 866–887.
Matthias Kohring and Fabian Zimmermann. 2018. Fake news and vote choice: A panel survey on the antecedents and consequences of fake news believability in the German parliamentary elections. (2018).
Thales Lelo. 2022. The rise of the Brazilian fact-checking movement: between economic sustainability and editorial independence. Journalism Studies 23, 9 (2022), 1077–1095.
Jiexun Li and Xiaohui Chang. 2023. Combating misinformation by sharing the truth: a study on the spread of fact-checks on social media. Information systems frontiers 25, 4 (2023), 1479–1493.
Chuang Liu, Xiu-Xiu Zhan, Zi-Ke Zhang, Gui-Quan Sun, and Pak Ming Hui. 2015. How events determine spreading patterns: information transmission via internal and external influences on social networks. New Journal of Physics 17, 11 (2015), 113045.
Yinhan Liu, Myle Ott, Naman Goyal, et al. 2019. RoBERTa: A Robustly Optimized BERT Pretraining Approach. CoRR abs/1907.11692 (2019). arxiv: 1907.11692 http://arxiv.org/abs/1907.11692
María Luengo and David García-Marín. 2020. The performance of truth: politicians, fact-checking journalism, and the struggle to tackle COVID-19 misinformation. American Journal of Cultural Sociology 8 (2020), 405–427.
Evangelos Maliaroudakis, Katarina Boland, Stefan Dietze, Konstantin Todorov, Yannis Tzitzikas, and Pavlos Fafalios. 2021. ClaimLinker: Linking text to a knowledge graph of fact-checked claims. In Companion Proceedings of the Web Conference 2021 . 669–672.
Paul Mena. 2019. Principles and boundaries of fact-checking: Journalists’ perceptions. Journalism practice 13, 6 (2019), 657–672.
Imran Mir and Arshad Zaheer. 2012. Verification of social impact theory claims in social media context. Journal of Internet banking and commerce 17, 1 (2012), 1.
Teija Norri-Sederholm, Elisa Norvanto, Karoliina Talvitie-Lamberg, and Aki-Mauri Huhtinen. 2020. Misinformation and disinformation in social media as the pulse of Finnish national security. Social Media and the Armed Forces (2020), 207–225.
Debora Nozza, Federico Bianchi, and Dirk Hovy. 2020. What the [mask]? making sense of language-specific BERT models. arXiv preprint arXiv: 2003.02912 (2020).
Faisal Rahutomo, Teruaki Kitasuka, Masayoshi Aritsugi, et al. 2012. Semantic cosine similarity. In The 7th international student conference on advanced science and technology ICAST , Vol. 4. University of Seoul South Korea, 1.
Nils Reimers and Iryna Gurevych. 2019. Sentence-bert: Sentence embeddings using siamese bert-networks. arXiv preprint arXiv: 1908.10084 (2019).
Alexander Sängerlaub. 2020. Fakten versus Fakes: Was Fact-Checking als Maßnahme gegen Desinformation leisten kann und was nicht. In Fake News und Desinformation . Nomos Verlagsgesellschaft mbH & Co. KG, 311–326.
Shaden Shaar, Nikola Georgiev, Firoj Alam, et al. 2021. Assisting the human fact-checkers: Detecting all previously fact-checked claims in a document. arXiv preprint arXiv: 2109.07410 (2021).
Shaden Shaar, Giovanni Da San Martino, Nikolay Babulkov, and Preslav Nakov. 2020. That is a known lie: Detecting previously fact-checked claims. arXiv preprint arXiv: 2005.06058 (2020).
Kai Shu, Amy Sliva, Suhang Wang, Jiliang Tang, and Huan Liu. 2017. Fake news detection on social media: A data mining perspective. ACM SIGKDD explorations newsletter 19, 1 (2017), 22–36.
Panayiotis Smeros, Carlos Castillo, and Karl Aberer. 2021. Sciclops: Detecting and contextualizing scientific claims for assisting manual fact-checking. In Proceedings of the 30th ACM international conference on information & knowledge management . 1692–1702.
Andon Tchechmedjiev, Pavlos Fafalios, Katarina Boland, Malo Gasquet, Matthäus Zloch, Benjamin Zapilko, Stefan Dietze, and Konstantin Todorov. 2019. ClaimsKG: A knowledge graph of fact-checked claims. In The Semantic Web–ISWC 2019: 18th International Semantic Web Conference, Auckland, New Zealand, October 26–30, 2019, Proceedings, Part II 18 . Springer, 309–324.
James Thorne and Andreas Vlachos. 2018. Automated fact checking: Task formulations, methods and future directions. arXiv preprint arXiv: 1806.07687 (2018).
Joseph E Uscinski and Ryden W Butler. 2013. The epistemology of fact checking. Critical Review 25, 2 (2013), 162–180.
Soroush Vosoughi, Deb Roy, and Sinan Aral. 2018. The spread of true and false news online. science 359, 6380 (2018), 1146–1151.
Liang Wu, Fred Morstatter, Kathleen M Carley, and Huan Liu. 2019. Misinformation in social media: definition, manipulation, and detection. ACM SIGKDD explorations newsletter 21, 2 (2019), 80–90.
Do you like what you are reading? Subscribe to receive updates.
Unsubscribe anytime