
Transhistorical Urban Landscape as Hypermap
Dario Negueruela del Castillo, Iacopo Neri, Paul Guhennec, Javier Argota Sánchez-Vaquerizo, Ludovica Schaerf, Valentine Bernasconi, Pepe Ballesteros Zapata
Published in HT '23: 34th ACM Conference on Hypertext and Social Media · DOI: 10.1145/3603163.3609083 · License: © Copyright held by the owner/author(s).
Authors: Dario Negueruela del Castillo, Iacopo Neri, Paul Guhennec, Javier Argota Sánchez-Vaquerizo, Ludovica Schaerf, Valentine Bernasconi, Pepe Ballesteros Zapata
Session: Interactive Media: Art and Design
Conference: HT '23
Abstract
The paper conceptualizes and prototypes a "hypermap" of Rome that links Nolli's 1748 map, Vasi's Grand Tour route, on-site sensor and photographic data, and generative image models into a folding/unfolding hypertextual framework for transhistorical urban exploration.
This article explores the conception, design, and implementation of a hypertextual map that we call hypermap. Using Giovanni Nolli’s 1748 map of the city of Rome as a backbone, we conducted an exper- iment based on one of the routes defined by Giuseppe Vasi’s Grand Tour of Rome to collect various types of urban and environmental information, thus aiming to connect a multiplicity of data from different nature and times periods to enhance the serendipitous elaboration of new narratives, interpretations, and data (namely "unfolding") not implicitly enacted by the pure analytical and mech- anistic overlapping of gathered data ("folding"). This experiment is part of the research project entitled Datathink that was conducted at the Bibliotheca Hertziana - Max Planck Institute for Art His- tory in Rome, the experiment serves as a proof of concept for an augmented database of the urban landscape in the city of Rome and new ways to facilitate the access and enhancement of cultural artifacts and knowledge.
1 Introduction
This article explores the conception, design, implementation, and contextualization of a hypertextual map (hypermap) as a proof of concept for an augmented database of the urban landscape in the city of Rome. Within the humanities and social sciences, and particularly in the fields of architecture and architectural and urban history, there is an urgent need to rethink the way we build pragmatic, linked, and interoperable databases from the ground up, leveraging connections to curated collections and controlled vocabularies. In this exercise, we put forward an exploration of hypermaps through a linked geohistorical data approach. Hypertextual linking opens the possibility of establishing multimodal connections and correspondences. We contend that this multimodality, when combined with a spatial dimension, constitutes a potential “augmentation” of the datascape as hypermap, greatly facilitating new perspectives across modalities and thus the emergence of new research questions. While this notion has already been used in diverse scholarly contexts like on self-organizing maps[12], in combinatorics [5], locative media and Linked Data [23] or as an alternative to hypertext [21]. Among others, we develop from the notion of hypermaps suggested by Laurini and Milleret-Raffort in [13]. We are interested in the capacity to isolate elements and remove context to facilitate the detection of patterns through elements not apparently commensurable, adding to the topological dimension of hypermaps. On the other hand, the re-introduction of a spatial dimension provides for topography and crucial contextual geography. A characteristic of the hypermap is the capacity to flip between the two, providing a multifold heuristical tool. It is to be noted that these
Ccs Concepts
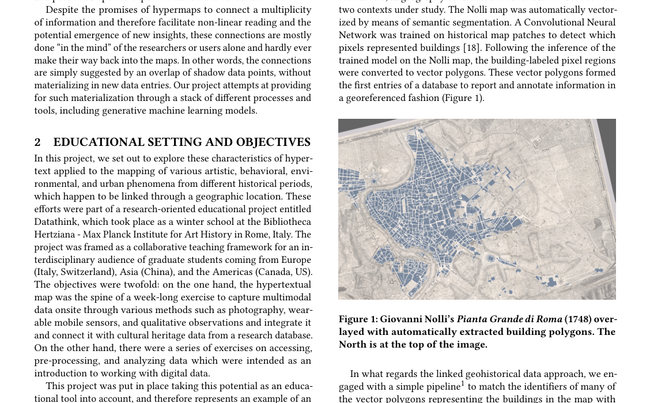
• Human-centered computing →Information visualization; • Applied computing →Fine arts. ACM Reference Format: Dario Negueruela del Castillo, Iacopo Neri, Paul Guhennec, Javier Argota Sánchez-Vaquerizo, Ludovica Schaerf, Valentine Bernasconi, and Pepe Ballesteros Zapata. 2023. Transhistorical Urban Landscape as Hypermap. ∗All authors contributed equally to the paper aims seem to overlap with concepts related to multiverses and digital twins, as the platform, technologies, and means involved may be the same. The affordances, and above all, intentions, are, however, radically different from the technocratic, efficiency-seeking, digital twins that try to mirror in real-time what exists in cities [6], as they are conceived nowadays. In contrast, the hypermap framed here aims to promote the knowledge of what has never been seen in the city and help expand human cognition. It is speculative visions of alternative cities that are able to overcome purely big data-centric approaches to cities and their models. [4] While we are aware of the body of work from Media Geography that deals with the critique of coded spaces [8], including the concerns about the invisibility of code and its integral role in practices of “sousveillance” [11] and integration into broader “technologies of power” [9], we modestly approach this framework as precisely trying to make this exercise of augmentation of historical space explicit and render its challenges and potentials open to experimentation and reflection. Despite the promises of hypermaps to connect a multiplicity of information and therefore facilitate non-linear reading and the potential emergence of new insights, these connections are mostly done “in the mind” of the researchers or users alone and hardly ever make their way back into the maps. In other words, the connections are simply suggested by an overlap of shadow data points, without materializing in new data entries. Our project attempts at providing for such materialization through a stack of different processes and tools, including generative machine learning models. di alcune città, e castelli suburbani”, published in 1761, which, accompanied by the series of etchings on the monuments of Rome (Sulle Magnificenze di Roma Antica e Moderna) published over ten books, constitute one of the main reference guides to the Rome of the Grand Tour. In this regard, Vasi’s extensive and rich production provided a well-defined context to be juxtaposed to the urban landscape of contemporary Rome, spanning from Piazza del Popolo and Via del Corso to Piazza del Colosseo. As the first day of his proposed Grand Tour became the main subject of study, an additional link to the historical city was introduced through Giovanni Battista Nolli’s Pianta Grande di Roma from 1748, which further contextualized the visual and textual entries from Vasi’s sources. Together, these two references acted as coordinates that permit the link between two cities - the historical Rome and its present-day version - that, overlaid in space, were misaligned in time. Within this framework, accessing Nolli’s map played a fundamental role, as geography constituted the shortest link between the two contexts under study. The Nolli map was automatically vectorized by means of semantic segmentation. A Convolutional Neural Network was trained on historical map patches to detect which pixels represented buildings [18]. Following the inference of the trained model on the Nolli map, the building-labeled pixel regions were converted to vector polygons. These vector polygons formed the first entries of a database to report and annotate information in a georeferenced fashion (Figure 1). 2
Educational Setting And Objectives
In this project, we set out to explore these characteristics of hypertext applied to the mapping of various artistic, behavioral, environmental, and urban phenomena from different historical periods, which happen to be linked through a geographic location. These efforts were part of a research-oriented educational project entitled Datathink, which took place as a winter school at the Bibliotheca Hertziana - Max Planck Institute for Art History in Rome, Italy. The project was framed as a collaborative teaching framework for an interdisciplinary audience of graduate students coming from Europe (Italy, Switzerland), Asia (China), and the Americas (Canada, US). The objectives were twofold: on the one hand, the hypertextual map was the spine of a week-long exercise to capture multimodal data onsite through various methods such as photography, wearable mobile sensors, and qualitative observations and integrate it and connect it with cultural heritage data from a research database. On the other hand, there were a series of exercises on accessing, pre-processing, and analyzing data which were intended as an introduction to working with digital data. This project was put in place taking this potential as an educational tool into account, and therefore represents an example of an open-ended and relatively content-agnostic workflow. Figure 1: Giovanni Nolli’s Pianta Grande di Roma (1748) overlayed with automatically extracted building polygons. The North is at the top of the image. In what regards the linked geohistorical data approach, we engaged with a simple pipeline1 to match the identifiers of many of the vector polygons representing the buildings in the map with those of the modern map of Rome as collected in Open Street Map2. This, in turn, allows for linking these to authoritative and specialized sources such as the institutional repositories of the Bibliotheca Hertziana through the German National Library identifier GND contained for such buildings in Wikidata3. In this new digital context 3
Methods And Results
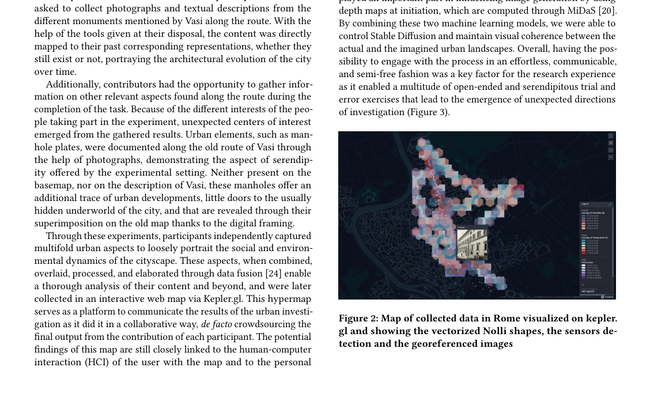
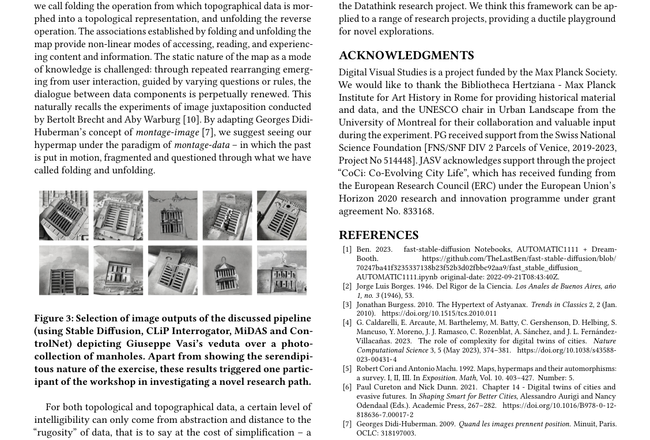
3.1 The map as a guide As an entry point to the very rich and historically dense urban landscape of the city of Rome, we used Giuseppe Vasi’s “Itinerario istruttivo per ritrovare con facilità tutte le Magnificenze di Roma e 1Accessible here: https://github.com/biblhertz/Datathink23MappingGND 2https://www.openstreetmap.org/ 3https://www.wikidata.org/ Transhistorical Urban Landscape as Hypermap and the consideration of a hypermap based on the Nolli historical document, the aim was to bridge time periods and play with differentiated situated perspectives that are located at certain times and places, as opposed to temporal immersive reconstructions. and unique experience of each interaction, but, differently from standard maps, they allow the users to feed this unique interaction into the map, collaboratively stimulating new possibilities of interaction. 3.3 Processing the collected data 3.2 Gathering the data In this regard and in opposition to the sensors campaign which rendered a view of the city unimaginable at Vasi’s time, the images collected provided an opportunity to further speculate on the historical twin of Rome, exploiting state-of-the-art machine learning models for image generation. We explored a cityscape that stylistically depicted Vasi’s themes while using contemporary Rome as canvas. Currently, it is well known that the field of image generation is undergoing a significant surge, with numerous models and techniques being developed on a daily basis. Machine learning models such as Stable Diffusion [22] make it easy and effortless to generate high-quality images that tightly represent textual prompts, allowing almost any user to engage in the process of creating visual content. Compared to its competitors - and mostly thanks to the public availability of the model - Stable Diffusion has been fostering an active community of artists and engineers, which produced a plethora of tools to expand its original capacities. Among these, the Automatic1111 WebUI framework – further adapted to run remotely in Google Colab [1] – permitted to fully and freely control Stable Diffusion with text prompts relevant to reproduce stylistically Vasi’s views, which were retrieved via CLiPInterrogator [19]. Additionally, machine learning models such as ControlNet [25] played an important part in influencing image generation by using depth maps at initiation, which are computed through MiDaS [20]. By combining these two machine learning models, we were able to control Stable Diffusion and maintain visual coherence between the actual and the imagined urban landscapes. Overall, having the possibility to engage with the process in an effortless, communicable, and semi-free fashion was a key factor for the research experience as it enabled a multitude of open-ended and serendipitous trial and error exercises that lead to the emergence of unexpected directions of investigation (Figure 3). The Nolli map was consequently used as a basemap to guide a hybrid and loose mapping campaign of Rome with georeferenced data via sensors and mobile cameras. In order to do so, cross-platform mobile applications were used, such as Avenza Map, which allows to visualize one’s location on the basemap and directly store images and texts on specific geographical coordinates. The participants captured instantaneous anonymous environmental data along the Vasi’s path using a CoSense unit for air quality monitoring (i.e. temperature, humidity, PM1, PM2.5, and PM10) [17] and a GQ EMF-390 sensor [14] for electromagnetic activity (i.e. raw intensity of radio-frequency, electro-magnetic, and electric fields without gathering private information regarding WiFi and mobile networks) (Figure 2). The information retrieved was then paired with geographical data with the help of the mobile application Geo Tracker, which was simultaneously used to follow the position of the sensor and connect it to the basemap. This type of sensing, inconceivable in the 18th century, uncovers hidden aspects that reflect human activity and natural events. On the other hand, these invisible factors have an impact on human health and behavior and can affect urban life [15, 16]. On top of this environmental data, the participants were also asked to collect photographs and textual descriptions from the different monuments mentioned by Vasi along the route. With the help of the tools given at their disposal, the content was directly mapped to their past corresponding representations, whether they still exist or not, portraying the architectural evolution of the city over time. Additionally, contributors had the opportunity to gather information on other relevant aspects found along the route during the completion of the task. Because of the different interests of the people taking part in the experiment, unexpected centers of interest emerged from the gathered results. Urban elements, such as manhole plates, were documented along the old route of Vasi through the help of photographs, demonstrating the aspect of serendipity offered by the experimental setting. Neither present on the basemap, nor on the description of Vasi, these manholes offer an additional trace of urban developments, little doors to the usually hidden underworld of the city, and that are revealed through their superimposition on the old map thanks to the digital framing. Through these experiments, participants independently captured multifold urban aspects to loosely portrait the social and environmental dynamics of the cityscape. These aspects, when combined, overlaid, processed, and elaborated through data fusion [24] enable a thorough analysis of their content and beyond, and were later collected in an interactive web map via Kepler.gl. This hypermap serves as a platform to communicate the results of the urban investigation as it did it in a collaborative way, de facto crowdsourcing the final output from the contribution of each participant. The potential findings of this map are still closely linked to the human-computer interaction (HCI) of the user with the map and to the personal Figure 2: Map of collected data in Rome visualized on kepler. gl and showing the vectorized Nolli shapes, the sensors detection and the georeferenced images 4
Discussion
At its core, we suggest a hypermap framework that offers the ability to fluidly navigate between two spaces hitherto hardly put in contact with one another. On one hand, the world of topographical data, that is of geographically-located entries, of urban context, physical neighboring, and noise. It is the world of sensors, of cartographic polygons, of georeferenced surveys. On the other lies the topological data space: galleries of photographs, and textual descriptions, whose absence of rigorous coordinates is replaced by abstract comparison, and thematic groupings. As such, the hypermap echoes the objectives of the hypertext: a multifaceted concept allowing to capture "a multiplicity of potential gateways to correspondences, notably between different narrative registers and modes"[3]. We understand the hypermap as a fabric onto which multimodal data is weaved, and that can be physically manipulated, twisted, or deformed. Considering the hypermap as a physical object that can nonetheless be played with lets us feel how data objects can be abstracted from their original context, yet without the permanent removal of that context. It is indeed from this (metaphorical) playing with our data space that connections are discovered and that a fertile non-linearity among multimodal and transhistorical data emerges. Sticking to this phenomenological description of our hypermap, we call folding the operation from which topographical data is morphed into a topological representation, and unfolding the reverse operation. The associations established by folding and unfolding the map provide non-linear modes of accessing, reading, and experiencing content and information. The static nature of the map as a mode of knowledge is challenged: through repeated rearranging emerging from user interaction, guided by varying questions or rules, the dialogue between data components is perpetually renewed. This naturally recalls the experiments of image juxtaposition conducted by Bertolt Brecht and Aby Warburg [10]. By adapting Georges DidiHuberman’s concept of montage-image [7], we suggest seeing our hypermap under the paradigm of montage-data – in which the past is put in motion, fragmented and questioned through what we have called folding and unfolding. Figure 3: Selection of image outputs of the discussed pipeline (using Stable Diffusion, CLiP Interrogator, MiDAS and ControlNet) depicting Giuseppe Vasi’s veduta over a photocollection of manholes. Apart from showing the serendipitous nature of the exercise, these results triggered one participant of the workshop in investigating a novel research path. For both topological and topographical data, a certain level of intelligibility can only come from abstraction and distance to the “rugosity” of data, that is to say at the cost of simplification – a well-known trope in science [2]. The obstructions induced by the different natures of data (type, coverage, degree of abstraction, levels of detail) open up a gap. Our folding/unfolding of the hypermap playfully tackles that gap. By reuniting and overlapping multimodal data and giving the dataspace an operative dimension, we stimulate the exploration of several narrative threads and the discovery of incongruous and incommensurable phenomena. Hypermaps, as we see them, hold the potential of overcoming purely data-driven analytical approaches (currently dominated by machine learning techniques) to give room to exploratory visualization-driven approaches and create insights and new layers of knowledge. This can enhance the potential to discover, define or just make explicit new relationships susceptible to be part of semantic knowledge graphs. 5
Conclusion
The main contribution of this paper is the conceptualization of a flexible hypermap framework, able to stimulate novel and serendipitous connections among incommensurable layers of a city using the map as the linking space. We presented a theoretical discussion on the affordances of such a map and an exemplar application of this framework to the city of Rome, bridging Vasi’s Rome to the contemporary impressions of the city, captured in the occasion of the Datathink research project. We think this framework can be applied to a range of research projects, providing a ductile playground for novel explorations.
Acknowledgments
Digital Visual Studies is a project funded by the Max Planck Society. We would like to thank the Bibliotheca Hertziana - Max Planck Institute for Art History in Rome for providing historical material and data, and the UNESCO chair in Urban Landscape from the University of Montreal for their collaboration and valuable input during the experiment. PG received support from the Swiss National Science Foundation [FNS/SNF DIV 2 Parcels of Venice, 2019-2023, Project No 514448]. JASV acknowledges support through the project “CoCi: Co-Evolving City Life”, which has received funding from the European Research Council (ERC) under the European Union’s Horizon 2020 research and innovation programme under grant agreement No. 833168.
Figures
References
[1] Ben. 2023. fast-stable-diffusion Notebooks, AUTOMATIC1111 + DreamBooth. https://github.com/TheLastBen/fast-stable-diffusion/blob/ 70247ba41f3235337138b23f52b3d02fbbc92aa9/faststablediffusion AUTOMATIC1111.ipynb original-date: 2022-09-21T08:43:40Z. [2] Jorge Luis Borges. 1946. Del Rigor de la Ciencia. Los Anales de Buenos Aires, año 1, no. 3 (1946), 53. [3] Jonathan Burgess. 2010. The Hypertext of Astyanax. Trends in Classics 2, 2 (Jan. 2010). https://doi.org/10.1515/tcs.2010.011 [4] G. Caldarelli, E. Arcaute, M. Barthelemy, M. Batty, C. Gershenson, D. Helbing, S. Mancuso, Y. Moreno, J. J. Ramasco, C. Rozenblat, A. Sánchez, and J. L. FernándezVillacañas. 2023. The role of complexity for digital twins of cities. Nature Computational Science 3, 5 (May 2023), 374–381. https://doi.org/10.1038/s43588023-00431-4 [5] Robert Cori and Antonio Machı. 1992. Maps, hypermaps and their automorphisms: a survey. I, II, III. In Exposition. Math, Vol. 10. 403–427. Number: 5. [6] Paul Cureton and Nick Dunn. 2021. Chapter 14 - Digital twins of cities and evasive futures. In Shaping Smart for Better Cities, Alessandro Aurigi and Nancy Odendaal (Eds.). Academic Press, 267–282. https://doi.org/10.1016/B978-0-12818636-7.00017-2 [7] Georges Didi-Huberman. 2009. Quand les images prennent position. Minuit, Paris.
Oclc: 318197003.
Transhistorical Urban Landscape as Hypermap [8] Martin Dodge and Rob Kitchin. 2005. Codes of Life: Identification Codes and the Machine-Readable World. Environment and Planning D: Society and Space 23, 6 (Dec. 2005), 851–881. https://doi.org/10.1068/d378t [17] Sachit Mahajan. 2022. Design and development of an open-source framework for citizen-centric environmental monitoring and data analysis. Scientific Reports 12, 1 (Aug. 2022), 14416. https://doi.org/10.1038/s41598-022-18700-z [9] Michel Foucault. 1988. Technologies of the Self. Tavistock Publications. [18] Rémi Petitpierre. 2020. Neural networks for semantic segmentation of historical city maps: Cross-cultural performance and the impact of figurative diversity. (2020). https://doi.org/10.13140/RG.2.2.10973.64484 arXiv:2101.12478 [cs, eess]. [10] Cesar Huapaya. 2022. Montage and Image as Paradigm. Revista Brasileira de Estudos da Presença 6, 1 (Oct. 2022), 110–123. https://seer.ufrgs.br/index.php/ presenca/article/view/59965 Section: Outros Temas. [19] pharmapsychotic. 2023. clip-interrogator. https://github.com/pharmapsychotic/ clip-interrogator original-date: 2022-08-09T00:31:16Z. [11] Rob Kitchin and Martin Dodge. 2007. Rethinking maps. Progress in Human Geography 31, 3 (June 2007), 331–344. https://doi.org/10.1177/0309132507077082 [20] René Ranftl, Alexey Bochkovskiy, and Vladlen Koltun. 2021. Vision Transformers for Dense Prediction. ICCV (2021). [12] Teuvo Kohonen. 1991. The Hypermap Architecture. In Artificial Neural Networks, Teuvo Kohonen, Kai Mäkisara, Olli Simula, and Jari Kangas (Eds.). North-Holland, Amsterdam, 1357–1360. https://doi.org/10.1016/B978-0-444-89178-5.50088-9 [21] Sharon B. Reynolds and Donald F. Dansereau. 1990. The knowledge hypermap: An alternative to hypertext. Computers & Education 14, 5 (Jan. 1990), 409–416. https://doi.org/10.1016/0360-1315(90)90034-5 Number: 5. [13] Robert Laurini and Françoise Milleret-Raffort. 1989. Principles of geomatic hypermaps. Ekistics (1989), 312–317. Publisher: JSTOR. [22] Robin Rombach, Andreas Blattmann, Dominik Lorenz, Patrick Esser, and Björn Ommer. 2022. High-Resolution Image Synthesis With Latent Diffusion Models. In Proceedings of the IEEE/CVF Conference on Computer Vision and Pattern Recognition
(Cvpr). 10684–10695.
[14] GQ Electronics LCC. 2019. Advanced GQ EMF-390 Multi-Field, Multi-Function EMF Meter and RF Spectrum Power Analyzer. https://www.gqelectronicsllc. com/comersus/store/comersusviewItem.asp?idProduct=5678 [15] Jin Liu, Minhong Wei, Huafang Li, Xin Wang, Xiaoyu Wang, and Song Shi.
Measurement and mapping of the electromagnetic radiation in the urban
environment. Electromagnetic Biology and Medicine 39, 1 (Jan. 2020), 38–43. https: //doi.org/10.1080/15368378.2019.1685540 Publisher: Taylor & Francis eprint: https://doi.org/10.1080/15368378.2019.1685540. [23] Silviu Vert and Radu Vasiu. 2014. Integrating Linked Data in Mobile Augmented Reality Applications. In Information and Software Technologies, Giedre Dregvaite and Robertas Damasevicius (Eds.). Springer International Publishing, Cham, 324–333. [24] Roy Williams. 1996. Dreaming of Hypermaps. Engineering and Science 59, 2 (1996), 2–9. https://calteches.library.caltech.edu/3818/1/Williams.pdf [16] Zhi-Nan Lu, Heyin Chen, Yu Hao, Jingyi Wang, Xiaojie Song, and Toi Meng Mok.
The dynamic relationship between environmental pollution, economic development and public health: Evidence from China. Journal of Cleaner Production
166 (Nov. 2017), 134–147. https://doi.org/10.1016/j.jclepro.2017.08.010 [25] Lvmin Zhang and Maneesh Agrawala. 2023. Adding Conditional Control to Text-to-Image Diffusion Models. arXiv:2302.05543 [cs.CV]
Figures from the paper
Do you like what you are reading? Subscribe to receive updates.
Unsubscribe anytime