

Role of the Website Structure in the Diversity of Browsing Behaviors
Authors
Pedro Ramaciotti Morales — Sorbonne Université, CNRS, LIP6, F-75005 Paris, France
Lionel Tabourier — Sorbonne Université, CNRS, LIP6, F-75005 Paris, France
Sylvain Ung — Sorbonne Université, CNRS, LIP6, F-75005 Paris, France
Christophe Prieur — I3, CNRS, Telecom ParisTech, Paris, France
ABSTRACT
The quantitative measurement of the diversity of information con- sumption has emerged as a prominent tool in the examination of relevant phenomena such as filter bubbles. This paper proposes an analysis of the diversity of the navigation of users inside a website through the analysis of server log files. The methodology, guided and illustrated by a case study, but easily applicable to other cases, establishes relations between types of users’ behavior, site struc- ture, and diversity of web browsing. Using the navigation paths of sessions reconstructed from the log file, the proposed methodol- ogy offers three main insights: 1) it reveals diversification patterns associated with the page network structure, 2) it relates human browsing characteristics (such as multi-tabbing or click frequency) with the degree of diversity, and 3) it helps identifying diversifica- tion patterns specific to subsets of users. These results are in turn useful in the analysis of recommender systems and in the design of websites when there are diversity-related goals or constrains.
CCS CONCEPTS
• Information systems →Web log analysis.
KEYWORDS
diversity; filter bubbles; web-browsing patterns; log analysis
ACM Reference Format: Pedro Ramaciotti Morales, Lionel Tabourier, Sylvain Ung, and Christophe Prieur. 2019. Role of the Website Structure in the Diversity of Browsing Behaviors. In 30th ACM Conference on Hypertext and Social Media (HT ’19), September 17–20, 2019, Hof, Germany. ACM, New York, NY, USA, 10 pages. https://doi.org/10.1145/3342220.3343648
1 INTRODUCTION
In many areas such as life sciences, economics, finance, public pol- icy, information theory, media studies, social sciences, and opinion dynamics, diversity refers to a property of a set of elements of in- terest, capable of revealing and quantifying notions such as variety, balance, and disparity [45].
Permission to make digital or hard copies of all or part of this work for personal or classroom use is granted without fee provided that copies are not made or distributed for profit or commercial advantage and that copies bear this notice and the full citation on the first page. Copyrights for components of this work owned by others than the author(s) must be honored. Abstracting with credit is permitted. To copy otherwise, or republish, to post on servers or to redistribute to lists, requires prior specific permission and/or a fee. Request permissions from permissions@acm.org. HT ’19, 17-20 September 2019, Hof, Germany © 2019 Copyright held by the owner/author(s). Publication rights licensed to ACM. ACM ISBN 978-1-4503-6885-8/19/09...$15.00 https://doi.org/10.1145/3342220.3343648
133
Much research has been conducted to characterize the diver- sity of information consumption in social media and news outlets. On the other hand there has been, for nearly two decades, a large amount of research dedicated to studying the browsing behavior of web users. Nonetheless, fewer studies have been devoted to the diversity of browsing behavior of users within a website. When reconstructed using transaction logs such as web server logs, navi- gation paths offer an interesting object of study. These allow for the investigation of the relationship between the page network structure and characteristics of human behavior when browsing. However, to relate this kind of analysis with the issue of diversity, one needs to get access to web server logs with both annotation for the contents over which to measure diversity, and annotated roles of webpages within the structure of a website.
The work presented in this article aims at exploring the question of how does the structure of a website influence the diversity of content explored by users. For this purpose, we use a web server log with the annotations of both the topic and the functional role (e.g. menu pages, forums, articles, ...) of the pages requested. Our approach is indeed illustrated on an original dataset, containing three weeks of web browsing on Melty, a prominent French infor- mation and entertainment website targeting young adults. Studies of navigation logs often focus on major web platforms, such as Facebook, Twitter or Wikipedia. Here, we have access to the logs of a site which can be described in terms of traffic as second-tier (a few million visits per week). Its structure and contents are quite typical of a category of websites which altogether represents a large part of the traffic on the web. We explore the patterns by which users are able to browse various topics and describe the relation be- tween the functional role of a page, and the diversity of consumed information.
The main contribution of this article is a method to analyze the diversity of information consumption in browsing. We divide sessions into subgroups and aim at identifying different types of behaviors among users. From there, we define and measure patterns related to diversification processes and suggest explanations of how diversity consumption is affected by the site structure in our specific case study. However, the method can be applied to any case where it is possible to label pages based on their functional role, and also on the topic with which they deal. Such a situation is usual in e- commerce sites, social networks, or media outlets to name a few. We also analyze the temporal dynamics of diversity consumption, and its relation with bubble-like phenomena.
This article is organized in five sections. We first present related works on the two main topics discussed in this study: the measure- ment of diversity and the analysis of web logs. Then, we describe
133
the dataset used, how it is preprocessed and how diversity will be defined and computed in the rest of the study. Next, we use this notion of diversity to explore the aggregated consumption of all users and motivate the analysis of the relation between the role and the content of pages. As we are looking for a natural way to classify browsing behaviors, we then produce a clustering partition of the sessions to identify and characterize different types of browsing activity. This will lead us to quantify the relation between types of browsing and diversifying patterns. Then, we discuss these results and suggest possible explanations for the patterns observed, and finally conclude on the applications of these analyses to recom- mender systems and website design.
2 RELATED WORK
The diversity of information consumption on the web (e.g. press articles, commercial items, posts on social media) has attracted growing attention in recent years. Different diversity measures have emerged as useful tools to describe pressing issues related to phenomena such as filter bubbles, echo chambers, and the develop- ment of extreme opinions [35]. In commercial applications, such as designing and improving recommender systems, diversity is the fo- cus of increasing interests as it relates to user satisfaction, exposure to new relevant products, and even customization and context- aware platforms [1, Section 7.3]. Several previous works study the characterization of the diversity of information consumption on social platforms such as Twitter [4], Facebook [40], and from news outlets [14, 22]. In commercial applications, diversity has come to be seen as an integral part of users’ satisfaction [15, 38, 48, 52] and its measurement has become a tool in the search of a broader understanding of browsing behaviors, e.g. automatic detection of change of context [23].
The study of web logs is a field of research that counts a wealth of works [2, 20, 36, 41], and we cannot aim at providing a survey on the topic in this article. The use of web log analyses to gain insight on how the structure of a website affects user navigation is a well established domain of research. Several studies investigate how the structure of a website influences the ability of users to obtain desired resources [19, 25, 26, 30]. Other studies have focused on the relation between the structure of websites and browsing paths taken by users [11, 32, 34, 39, 50, 51].
Systematic web log analysis has allowed for improvements in the design of websites [10], predicting the resource a user is looking for or the location in which it is expected to be found [42, 47]. Web log analysis also offers the possibility of dynamic and/or personal- ized adjustments to the structure of websites [9, 16]. While most advancements make use of web logs, or even of contents of pages in a site [24], fewer studies use the logs to address the question of the diversity of the contents browsed. This question has been recently related to filter bubbles [28, 31]. Some studies focus on navigation volume [27] and on the diversity of types of users and navigation patterns [29], but not so many on the diversity of consumption itself [33].
Studies addressing the question of consumed content diversity in browsing and site structure should account for ways of classifying pages according to content and to their role in the site structure. Some classifications of pages in web logs include information such
as differentiation of social platforms or search engine pages [47]. Our work tackles specifically the question of the influence of the website structure on the diversity of information consumption by users. In this study, diversity refers to a measure of variety and balance (in this case Shannon Entropy) of the topics consumed by a user while browsing a website in which each page can be classified as dealing with a given topic. In contrast with much of previous works, here the structure will be considered to be a given and not something to be learned from web log analysis: pages in the website have a fixed role within the structure (e.g. menu pages, articles, ...).
3 DATASET AND DIVERSITY COMPUTATION 3.1 Data general description
The data used for the study of browsing properties within a web- site is most often available in the form of a log file created by a web server which contains information about the requests made. Commonly used formats provide for each request, among other information: IP address of the client, the method and the resource requested from the client, the HTTP status code returned, the size of the object returned, and the timestamp of the request.
For our case study, we use the log files of a particular website: Melty (www.melty.fr), a French information and entertainment website targeting the 15-34 year-old demographics. From the data available to us, we chose a subset corresponding to 3 weeks of September 2017 as it was deemed sufficiently extensive for the illustration of the present analyses1. Tests made with other time periods yield similar results to what is presented in the following.
A general description of the structure of www.melty.fr is useful for the rest of our study. An examination of the site reveals that it is organized in a tree-like fashion. From the home page, users can access thematic menu pages (topic pages) for broad topics (such as music or TV), as well as more specific subtopic pages, or articles. Note also that links to menu pages are always present in the menu bar of most pages, which allows in theory for users to go to these menu pages from nearly anywhere in the site. From the topic pages, access is offered to other, more specific menu pages (subtopic pages) dedicated to the same topic, but with more specific content (e.g., a given band for the music topic). And from these specific pages, a user has access to various pages with different types of roles (e.g. articles, media pages, forums, photo galleries). This classification in terms of structural role is predefined in the website design.
Let us now describe a typical article page on the website. In ad- dition to the links accessible via the menu bar, a user may navigate through the website using various kinds of links. First, some links are anchored in the text of the article itself and are therefore static. The bottom part of an article is dedicated to dynamic recommenda- tion links, which either connect to external websites, or to other Melty pages.
3.2 Preprocessing and sessionization
Throughout our study we identify a user with a hash, combining their IP, logname, username, and session cookie. In the data avail- able to us, a hash function for creating user IDs in the log had
1The anonymized dataset is available at http://data.complexnetworks.fr/melty/
already been applied by Melty, rendering users anonymous so as to answer privacy concerns. The web server also complements the log information with the referral page of each request. This is useful for two reasons: it provides information about the paths followed by users along a session (for instance when they open browser tabs or windows by following several links from a same page), and it also gives information about where the users come from, in particular from a search engine or from a social media platform.
Number of Sessions
In order to analyze the log file, we must first discard the requests originating from non-human agents. For this purpose, we take a standard mixed approach, using syntactical log analysis and traffic pattern analysis [12]. Firstly, in a syntactical log analysis, we delete requests made by user agents known to be used by common robots. Secondly, in a traffic pattern analysis, we filter out requests from the log using some activity-based criteria taking elements from [5, 46]. Concretely, we excluded requests by users that requested more than 20 pages per minute or more than 900 pages per hour, as well as requests by users that were active for 20 or more consecutive hours.
We analyze the log at the session level rather than at the user level, our motivation being that a user may display different brows- ing behaviors in different sessions. For this purpose, we sessionize the log data. While there is no clear consensus about how to do so [21, 49], a reasonable strategy [18] makes use of a cutoff session- ization time. This time interval cutoff has been often found to be around 30 minutes, which is often used as a standard sessionization time parameter.
3.3 Data representation
We define here some general notations which are used in this work. Given a log file, we identify the set V of web pages and the set S of sessions present in it. T denotes the set of timestamps at which the requests were made. The comprehensive set R of requests in the log is such that R ⊆V × V × S ×T. For every request ℓin a log R we consider its source vs (ℓ) ∈V , i.e. the page where the request originated, its target vt (ℓ) ∈V , i.e. the requested page, and time t(ℓ) ∈T of the request. Table 1 and Figure 1 show a descriptive summary of the main parameters of the logs, after preprocessing and sessionization.
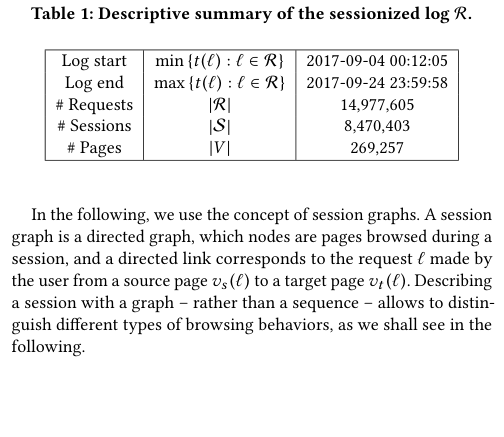
Table 1: Descriptive summary of the sessionized log R.
Log start min {t(ℓ) : ℓ∈R} 2017-09-04 00:12:05 Log end max {t(ℓ) : ℓ∈R} 2017-09-24 23:59:58 # Requests |R| 14,977,605 # Sessions |S| 8,470,403 # Pages |V | 269,257
In the following, we use the concept of session graphs. A session graph is a directed graph, which nodes are pages browsed during a session, and a directed link corresponds to the request ℓmade by the user from a source page vs (ℓ) to a target page vt (ℓ). Describing a session with a graph – rather than a sequence – allows to distin- guish different types of browsing behaviors, as we shall see in the following.
107
Sessions with 1 request: 6053079 (71.5%) Sessions with 2 requests: 1305332 (15.4%) Sessions with 3 requests: 439663 (5.2%) Sessions with 4 requests: 225809 (2.7%) Sessions with > 4 requests: 446520 (5.3%)
106
105
Number of Sessions
104
103
102
101
100
100 101 102 103 104
Number of Requests
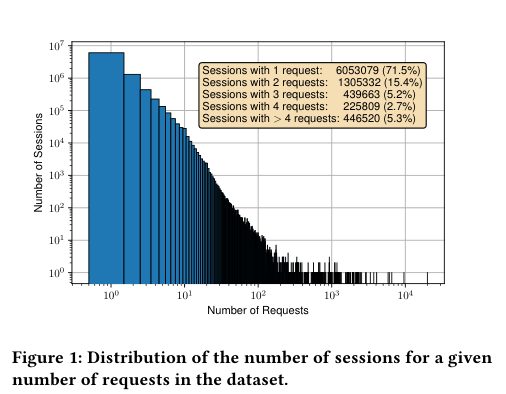
Figure 1: Distribution of the number of sessions for a given number of requests in the dataset.
3.4 Twofold page classification
It is often possible to describe the pages of a website according to a classification which has two dimensions: one describing the structural function of a page, and the other its content. In some cases, typically commercial websites, the content classification (e.g. furniture, electronics, books, films) is tightly related to the structure. Products are organized in categories according to a tree-like struc- ture, so that the website favors browsing within a same category. In other cases, e.g. Wikipedia, the relation is much more loose: a user has a high probability to change content category (e.g. mathemat- ics, history, biology) by following a hyperlink. Depending on the case under examination, the relation between the structural role of a page and its content may differ. In particular the possibility to navigate from a topic to another largely depends on design choices, as we will discuss in this study.
Our dataset exhibits such a classification, pages have an associ- ated content type (classifying the topic with which they deal, such as TV or Video games), and a functional category type (classifying the role that they play in the site, such as articles or forum pages). We naturally consider the diversity of page consumption in regards to their content. We denote the set of topics available by A, and the corresponding classification function CA : V →A, which assigns to each element of V a topic in A. Similarly, pages are assigned a structural role, which is an element of the role set B, corresponding to the classification function CB : V →B.
In the Melty website that is our case study, we have:
• content type set A={Celebrities, Comics, Movies, Music, News, Series, TV, VideoGames, Other}, • structural role set B={Article, Forum, Gallery, Quiz, Subtopic page, Topic page, Other}.
Pages which are B-labeled Topic page are menu pages for general topics in A, while pages which are B-labeled Subtopic pages are menu pages for more specific subjects within a topic in A. For example, the topic Music may have its own menu page of B-labeled Topic page, while some more specific subjects such as rock music could have their own menu page with B-label Subtopic page.
3.5 Consumption diversity computation
Whenever we have a subset of a log, L ⊆R (for example, the log of a user, or the log of a session), we can compute its diversity with respect to a page classification, e.g. CA, using Shannon entropy:
X
DA(L) = −
pA(L,a) log2 pA(L,a),
a∈A
with pA(L,a) = |{ℓ∈L : CA (vt (ℓ)) = a}|
L | . |
Given the Shannon entropy E of the information consumption related to some subset of requests L, we define its Iso-Entropic Uniform Consumption (IEUC) diversity index as 2E. This quantity is also known as perplexity in information theory [3]. The interest of quantifying diversity with IEUC is that it can be interpreted as the number of consumed types needed to produce the same entropy if the consumption was uniform, meaning that for any two types a, a′ in A, we would have pA(L,a) = pA(L,a′).
105
Requests
104
While other diversity metrics exist (Richness, Herfindhal Index, and Gini Index are notable examples), Shannon entropy (or simply the entropy) is a popular choice [13, 31, 37] because it accounts for the variety of types of elements (i.e. |A|, the size of A) and for the balance among them (i.e. the comparison between different values pA(L,a) for different a ∈A) while proving meaningful interpretations, see [44, Chapter 2] for a more detailed discussion. In the following, we refer to the entropy measurement as consumption diversity, as it reflects the variety of topics that a user goes through during a session on Melty website.
103
7
6
IEUC
5
4
3
2
4 AGGREGATED CONSUMPTION DIVERSITY
In order to get insights about some general features of the log dataset regarding consumption diversity, we first obtain some mea- surements on subsets of the log file, grouped according to the num- ber of requests in a session.
As expected when measuring aggregated human behavior on a website, we can see in Figure 1 that the number of requests per session is distributed heterogeneously, roughly following a power- law. Consequently, a majority of sessions (6,053,079, that is 71.5% of them) consist of only one request (i.e. requesting a single page without further navigating within the website). Then, the number of sessions with a given number of requests decreases, with only 5.3% (446,520) requesting more than 4 pages. Figure 2 shows how the content types vary according to the number of requests. It also specifies the associated entropy and IEUC. It can be observed that diversity decreases when the number of requests per session increases, therefore indicating that longer sessions tend to focus on the same type of content (and above all, TV).
Concerning the evolution of consumption diversity through time, the log presents regularities and particularities that we discuss here. For illustrative purposes, let us consider the week spanning from 9/18/2017 to 9/24/2017, and let us investigate the consumption volume and diversity of different groups of sessions, as shown in Figure 3.
When grouping sessions by number of requests, we observe that activity measures present some regularities in the hourly volume of requests, displaying growing activity during most of the day until spiking later before midnight. The evolution of the hourly diversity
Entropy IEUC
2.60 6.07
Total
TV Series Celebrities VideoGames Movies Music Comic Other
2.38 5.22
>4requests
2.42 5.34
4requests
2.51 5.71
3requests
2.68 6.39
2requests
2.70 6.49
1request
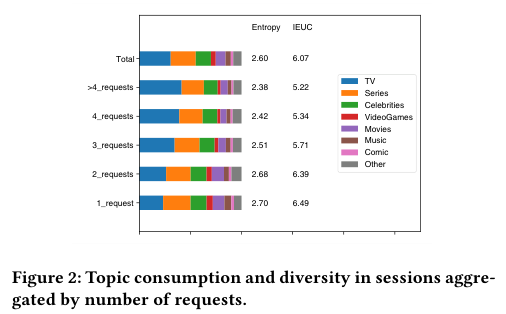
Figure 2: Topic consumption and diversity in sessions aggre- gated by number of requests.
Hourly Activity
105
Requests
104
Total Sessions with more than 4 requests Sessions originated in search pages Sessions originated in social platforms
103
7
6
IEUC
5
4
3
2
2017/9/18 2017/9/19 2017/9/20 2017/9/21 2017/9/22 2017/9/23 2017/9/24
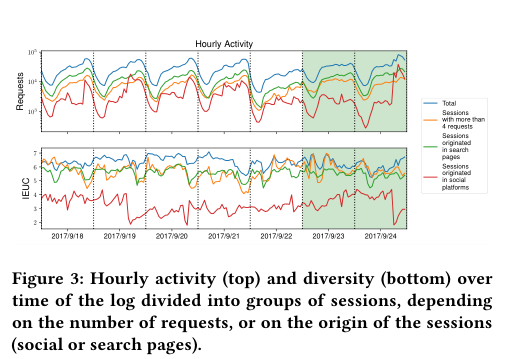
Figure 3: Hourly activity (top) and diversity (bottom) over time of the log divided into groups of sessions, depending on the number of requests, or on the origin of the sessions (social or search pages).
for the complete log is comparable to that of the group of sessions with more than 4 requests, although the value of the diversity of this higher engagement group is generally lower, in accordance with what was observed in Figure 2.
We also separate sessions by origin, distinguishing sessions which originate either from a search engine or from a social plat- form. Strong differences can be observed. Indeed, the consumption diversity of sessions originating from social platforms is noticeably lower than that of other groups. This type of phenomenon had been observed previously in [31]. Note that diversity as measured by entropy or IEUC is not affected by the volume of consumption, meaning that the fact that there are less sessions originating from social platforms should not affect the diversity measurements. The sudden diversity losses for browsing originating in social platforms are the consequence of surges of activity around specific content types. Figure 4 illustrates this effect through a more detailed ex- amination of one of these events: diversity loss observed on the afternoon of September 19th 2017 for consumption by sessions orig- inated in social platforms is related to a surge of activity focusing on the content type Movies.
Figure 5 further explains the diversity loss event. We measure the activity of the five most popular pages in browsing originated in social platforms around the time of the event. It reveals that a Melty page about a movie was abruptly requested in sessions
Activity Initiated in Social Platforms, September 19th 2017
15000
10−1
Sessions
10000
10−2
5000
10−3
10−4
0
TV Series Celebrities VideoGames Movies Music Comic Other
10−5
Topic Consumption
Proportion
0h 1h 2h 3h 4h 5h 6h 7h 8h 9h 10h 11h 12h 13h 14h 15h 16h 17h 18h 19h 20h 21h 22h 23h 24h
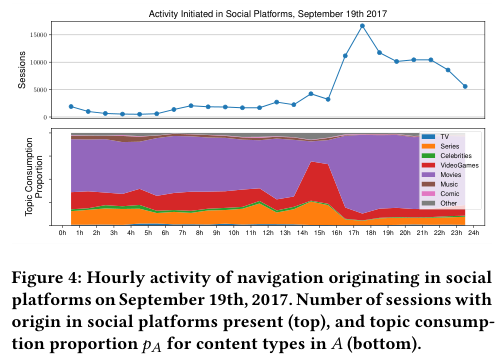
Figure 4: Hourly activity of navigation originating in social platforms on September 19th, 2017. Number of sessions with origin in social platforms present (top), and topic consump- tion proportion pA for content types in A (bottom).
coming from social platforms. In this particular case, the page is about Harry Potter movies, and traffic came from Facebook.
Activity of the five most popular pages, September 19th 2017
1st (Movies) 2nd (VideoGames) 3rd (Movies) 4th (Series) 5th (VideoGames)
300
Requests
200
100
0
12h 13h 14h 15h 16h 17h 18h 19h 20h
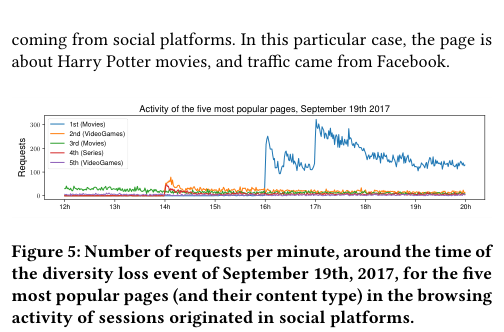
Figure 5: Number of requests per minute, around the time of the diversity loss event of September 19th, 2017, for the five most popular pages (and their content type) in the browsing activity of sessions originated in social platforms.
Finally, let us consider the weighted directed graph constructed by aggregating the whole log, sometimes referred to as browsing graph [47]. Its nodes are pages, directed edges represent requests from a source to a target page, and their weight is the number of times an edge was taken. Over this aggregated graph, we com- pute topological indices reflecting nodes centrality for each page: in- and out-degree, as well as betweenness centrality, calculated using [7]. We then group pages by structural role (classification B) and represent their Complementary Cumulative Distribution Function (CCDF) in Figure 6. We observe that topic pages clearly have a higher probability of having a high in- and out-degree, or betweenness centrality value than subtopic or article pages. This suggests that pages with different structural role labels seem to have different functions during navigation, as expected. Indeed, some pages tend to be navigation end pages (e.g. articles) while other act more like transit hubs (topic pages).
These elements motivate the description of the variety of sessions and the analysis of the diversification patterns associated with types of pages and groups of sessions.
5 CONSUMPTION DIVERSITY IN SESSION CLUSTERS
In this section, we define clusters which correspond to distinct sub- groups of browsing behaviors in the data. Precisely, we investigate
100 In Degree
100 Out Degree
100 Betweenness
sub-topic page topic page article
10−1
10−1
10−2
10−1
10−2
10−3
10−3
10−4
10−4
10−2
10−5
10−5
10−4 10−3 10−2 10−1 100
102 103 104 105
102 103 104 105 106
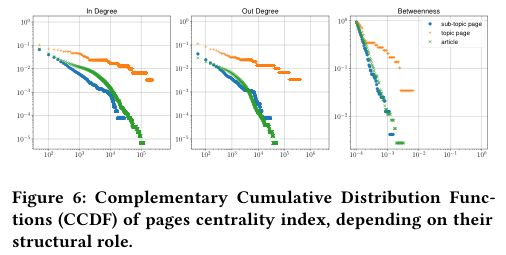
Figure 6: Complementary Cumulative Distribution Func- tions (CCDF) of pages centrality index, depending on their structural role.
how the consumption diversity of sessions is related to different features that characterize the browsing behavior of users, such as click frequency and tendency for multi-tabbing. For this purpose, we focus on sessions that contain more than 4 requests, as they bring sufficient information per session, without filtering too many sessions out of the data log. Indeed, we want to include structural information related to the session graphs in the clustering process, which demands to have several requests per session.
We aim at separating sessions into different groups according to quantitative properties. The features that we have selected for this purpose are known from previous works to be relevant features for session clustering [8, 43], namely:
• number of requests, • duration of the session, • mean time between requests, • standard deviation of the time between requests.
We also include a feature that describes the structure of the directed graph which represents the session. We use the star-chain index, adapted from [6], which is computed on the directed graph G = (V, E) of each session as:
di (v) −1
P
v ∈V,do (v)=0
star-chain index =
di (v) −1 ,
P
v ∈V
where di (v) and do(v) are the in- and the out-degrees of node v. The star-chain index is closer to 0 whenever the session graph has a chain-like form, and closer to 1 whenever a session graph rather resembles a star: one single node serving as the source of access to all others. Higher values of the star-chain index signal either a higher level of multi-tabbing in browsing, or a frequent use of the back button to revisit specific pages.
In the resulting feature space, we apply standard clustering tech- niques. We first perform a normalization on the various dimensions of the feature space. Precisely, all selected features exhibit a long- tailed distribution except the star-chain index, thus we apply a logarithmic transformation in order to avoid the outliers to play an overwhelming role in the clustering. Then, we normalize the values to obtain data with unit variance on each feature. We use a weighted k-means [17] clustering by stages, following [8], to cluster first in the space of the dimensions which are not related to the topology of the session graph (i.e. duration, number of requests, mean and standard deviation of time between requests) and then to cluster in the dimension of the star-chain index. We present the results for a
clustering in 6 clusters or groups. Different choices for the number of groups tend to show similar trends, so it has been chosen as the lowest value which allows to clearly separate qualitatively distinct browsing behaviors in relatively balanced clusters, as we shall see.
25
20
15
In order to summarize the results of the clustering, we show in Figure 7 the centroids of each cluster in the plane spanned by the first two principal components axes (PC-1 and PC-2) that better explain the variance of session features in the feature space, as computed using Principal Component Analysis (PCA). We observe that the first dimension is clearly defined by the star-chain index, while the second is dominated by session duration and number of requests.
10
PC-1 PC-2
−1.5
Star-Chain
0.96 -0.28
Index
−1.0
Mean Seconds Between Reqs.
0.10 0.27
−0.5
PC-2
Std. Deviation Seconds Between Reqs.
0.10 0.30
0.0
0.5
0.18 0.58
Duration
1.0
0.17 0.65
Num.of Requests
1.5
−1.5 −1.0 −0.5 0.0 0.5 1.0 1.5 2.0 PC-1
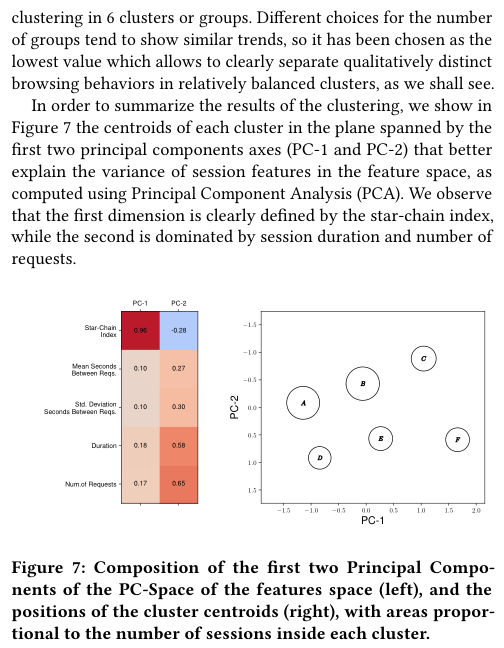
Figure 7: Composition of the first two Principal Compo- nents of the PC-Space of the features space (left), and the positions of the cluster centroids (right), with areas propor- tional to the number of sessions inside each cluster.
Figure 8 shows a random sampling of 5 sessions per cluster, illustrating qualitatively how these dominating features define each cluster. A more quantitative depiction of the characteristics of each cluster in the feature space is provided in Figure 9, which shows the distributions of the features for each cluster using box plots.
Cluster A (24.3%)
Cluster B (25.0%)
Cluster C (13.9%)
0 2 4 6 8 10 Minutes
0 2 4 6 8 10 Minutes
0 1 2 3 4 5 Minutes
Cluster D (11.4%)
Cluster E (12.7%)
Cluster F (12.7%)
0 5 10 15 20 25 Minutes
0 5 10 15 20 25 Minutes
0 16 32 48 64 80 Minutes
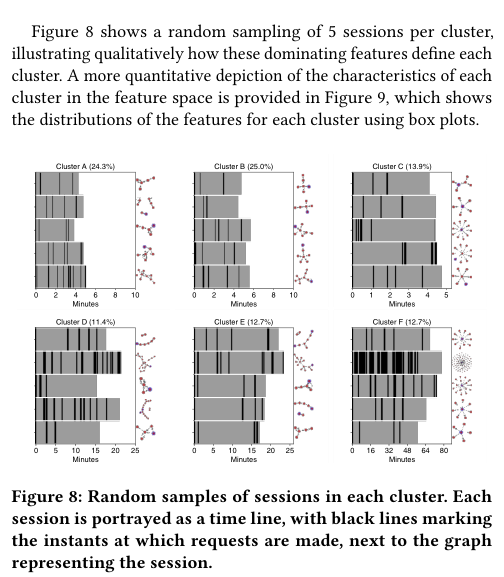
Figure 8: Random samples of sessions in each cluster. Each session is portrayed as a time line, with black lines marking the instants at which requests are made, next to the graph representing the session.
Duration (seconds)
Std. Dev. Between
Mean Time Between
Star-Chain
Requests
Reqs. (seconds)
Reqs. (seconds)
Index
1.0
8000
1000
25
1000
0.8
800
6000
800
20
0.6
600
600
4000
15
0.4
400
400
2000
10
0.2
200
200
A B C D E F 5
A B C D E F 0
A B C D E F 0
A B C D E F 0
A B C D E F 0.0
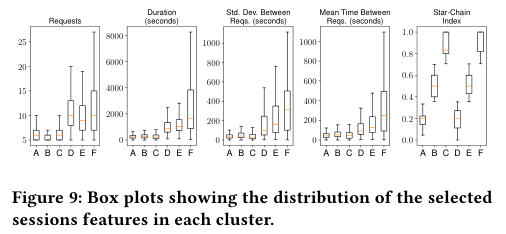
Figure 9: Box plots showing the distribution of the selected sessions features in each cluster.
More importantly, Table 2 summarizes relevant statistics for each cluster, in particular their sizes and consumption diversities. It can be seen that, among sessions with more than 4 requests, higher diversities tend to be related to more star-like sessions and to a lesser extent, longer sessions with more requests (which is not surprising). This suggests that star-like browsing is related to the possibility of switching topics more easily on this website. Another interesting observation is that sessions originating from a social network tend to be more star-like than chain-like. On the other hand, sessions originating from search engines tend to be more chain-like than star-like. However, we have previously observed that the later kind of sessions had higher diversity, as a group, than the former. These observations indicate not only that users behave differently depending on how they arrived on the website, but also that among each of the subgroups, a refined typology of browsing behaviors would be certainly useful.
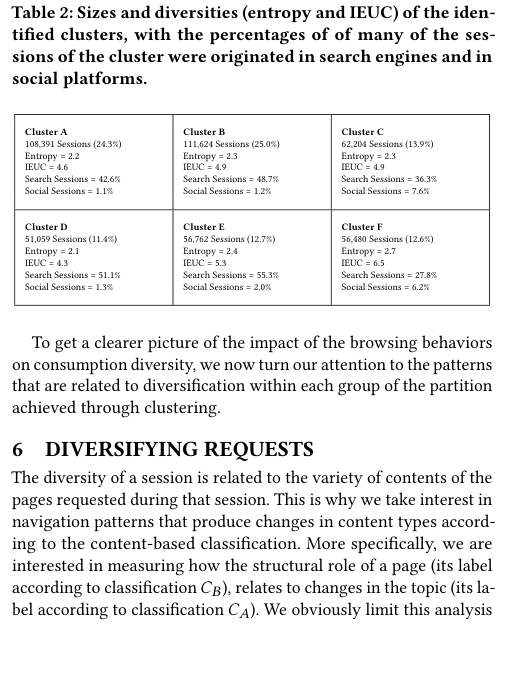
Table 2: Sizes and diversities (entropy and IEUC) of the iden- tified clusters, with the percentages of of many of the ses- sions of the cluster were originated in search engines and in social platforms.
Cluster A 108,391 Sessions (24.3%) Entropy = 2.2 IEUC = 4.6 Search Sessions = 42.6% Social Sessions = 1.1%
Cluster B 111,624 Sessions (25.0%) Entropy = 2.3 IEUC = 4.9 Search Sessions = 48.7% Social Sessions = 1.2%
Cluster C 62,204 Sessions (13.9%) Entropy = 2.3 IEUC = 4.9 Search Sessions = 36.3% Social Sessions = 7.6%
Cluster D 51,059 Sessions (11.4%) Entropy = 2.1 IEUC = 4.3 Search Sessions = 51.1% Social Sessions = 1.3%
Cluster E 56,762 Sessions (12.7%) Entropy = 2.4 IEUC = 5.3 Search Sessions = 55.3% Social Sessions = 2.0%
Cluster F 56,480 Sessions (12.6%) Entropy = 2.7 IEUC = 6.5 Search Sessions = 27.8% Social Sessions = 6.2%
To get a clearer picture of the impact of the browsing behaviors on consumption diversity, we now turn our attention to the patterns that are related to diversification within each group of the partition achieved through clustering.
6 DIVERSIFYING REQUESTS
The diversity of a session is related to the variety of contents of the pages requested during that session. This is why we take interest in navigation patterns that produce changes in content types accord- ing to the content-based classification. More specifically, we are interested in measuring how the structural role of a page (its label according to classification CB), relates to changes in the topic (its la- bel according to classification CA). We obviously limit this analysis
to the requests that link two pages inside Melty (source pages from outside —such as search engines or social platforms— are excluded). Also, we only consider the requests made during sessions with more than 4 requests, once again. Therefore the following analysis is performed over a subset of the original log, containing 2,064,552 requests and 380,506 sessions.
Given this subset L of the original log, let us consider the subset of requests going from a page with type (i.e., functional role) i ∈B to a page with type j ∈B, as follows:
Li→j = {ℓ∈L : CB(vs (ℓ)) = i ∧CB(vt (ℓ)) = j} .
Thus, we estimate the probability Pi→j that a given link goes from a role type i to a role type j in B as Pi→j = Li→j / |L|. We call the associated probability matrix the Browsing Pattern matrix. Note that this is different from the probability associated to the empirical Markovian matrix for L, which gives the probability, knowing the source node type i, to transit to a target node with type j.
Next, for a request ℓgoing from a page of type i ∈B to a page with type j ∈B, we are interested in estimating the probability that it produces a change of content type in A. Therefore, we estimate, for all i, j ∈B, the probabilities:
Ptrans(A)
i→j = P [i →j , CA (vs (ℓ)) , CA(vt (ℓ))] .
Using the subset L of the log as an empirical observation we estimate these probabilities as
(
) Li→j
ℓ∈Li→j : CA(vs (ℓ)) , CA(vt (ℓ))
Ptrans(A)
i→j =
.
We call the associated probability matrix the Diversifying Pattern matrix. We show the values computed on the log in Figure 10, arranged as matrices taking the role classification set B as indices. Some transitions between B-type categories are very rare. Thus, we set a threshold of 50 observations (requests) in the estimation of probability Ptrans(A)
i→j . When a transition does not reach this threshold, the estimation was not considered (marked with an X in the matrix) to avoid misinterpretations.
Let us first underline some characteristics of the global Browsing Pattern matrix over the data log shown in the upper part of Figure 10. Most requests go from an article to another article (that is 57.1% of the traffic), followed by requests from topic pages to articles (18.7%), and then by requests from subtopic pages to articles (6.7%). Now the Diversifying Pattern matrix (bottom part of the same figure) shows that the requests that most changed in content type go from topic pages to other topic pages (67.6% of the times, a topic transition occurred). More generally, requests to topic pages and, to a lesser extent, to subtopic pages, are often involved in topic transitions. Also, the Browsing Pattern matrix indicates that requests from topic and subtopic pages represent an important fraction of the traffic on the website. Topic pages in particular tend to have the role of hubs, as observed in Sec. 4. Thus, we can draw a first basic picture from these observations: users usually navigate from article to article but sometimes change topics by moving to topic and subtopic pages, from where they find new articles.
a Gallery d Forum b Quiz e Article c Sub-Topic Page f Topic Page
1.0
a b c d e f marg.
0.03 0.00 0.00 0.00 0.00 0.00 0.03
a
0.8
0.00 0.01 0.00 0.00 0.01 0.00 0.02
b
0.00 0.00 0.02 0.00 0.07 0.00 0.09
c
0.6
0.00 0.00 0.00 0.00 0.00 0.00 0.00
d
0.01 0.02 0.01 0.01 0.57 0.02 0.64
0.4
e
0.00 0.00 0.00 0.00 0.19 0.03 0.22
f
0.04 0.04 0.03 0.01 0.83 0.04 1.00 0.2
marg.
Browsing Matrix
1.0
a b c d e f p.s.
0.99 0.00 0.00 0.00 0.01 0.00 0.03
a
0.8
0.00 0.44 0.11 0.01 0.30 0.14 0.02
b
0.03 0.03 0.18 0.01 0.74 0.01 0.09
c
0.6
0.00 0.01 0.04 0.45 0.48 0.02 0.00
d
0.4
0.01 0.04 0.02 0.02 0.89 0.03 0.64
e
0.00 0.02 0.01 0.00 0.85 0.11 0.22
f
0.04 0.04 0.03 0.01 0.83 0.04 1.00 0.2
p.t.
Markov Matrix
a b c d e f p.s.
0.6
0.03 X 0.35 X 0.26 0.27 0.03
a
0.5
X 0.04 0.14 0.03 0.07 0.29 0.09
b
0.12 0.09 0.15 0.32 0.10 0.40 0.11
c
0.4
X 0.09 0.51 0.07 0.06 0.47 0.09
d
0.3
0.01 0.03 0.15 0.01 0.04 0.37 0.05
e
X 0.01 0.18 0.11 0.00 0.68 0.08
0.2
f
0.03 0.03 0.15 0.03 0.04 0.54 0.07 0.1
p.t.
Diversifying Matrix
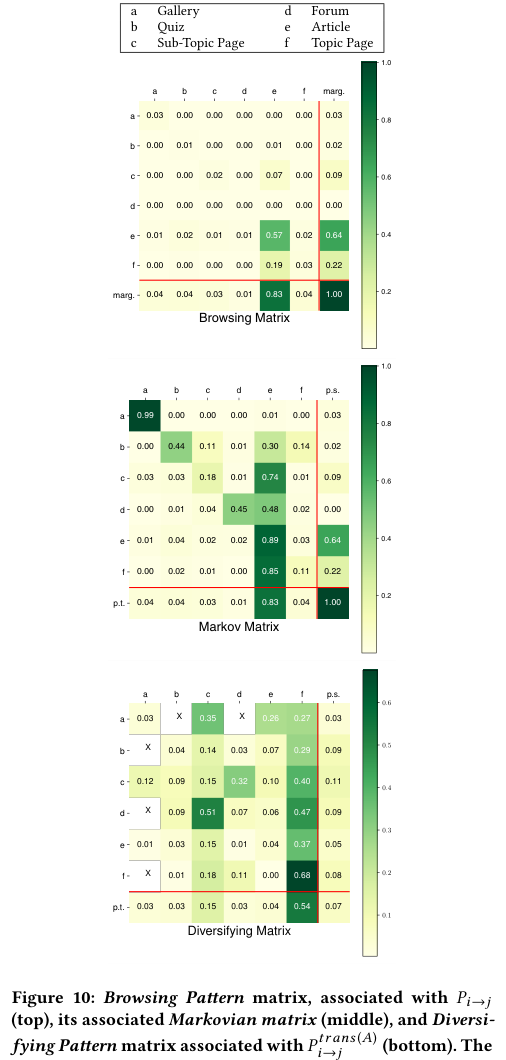
Figure 10: Browsing Pattern matrix, associated with Pi→j (top), its associated Markovian matrix (middle), and Diversi- fying Pattern matrix associated with Ptrans(A)
i→j (bottom). The marginals of each line and column are given respectively to the right and below each matrix. Probability of content tran- sition per type of source, and per type of target pages are indicated respectively as p.s and p.t.
While this sketches a general picture of the traffic of users across the site structure and the mechanisms through which diversifi- cation occurs, we are further interested in differentiating these mechanisms for groups of sessions. The same measures, listing the first 3 browsing and diversifying kinds of requests per cluster yields the results shown in Table 3.
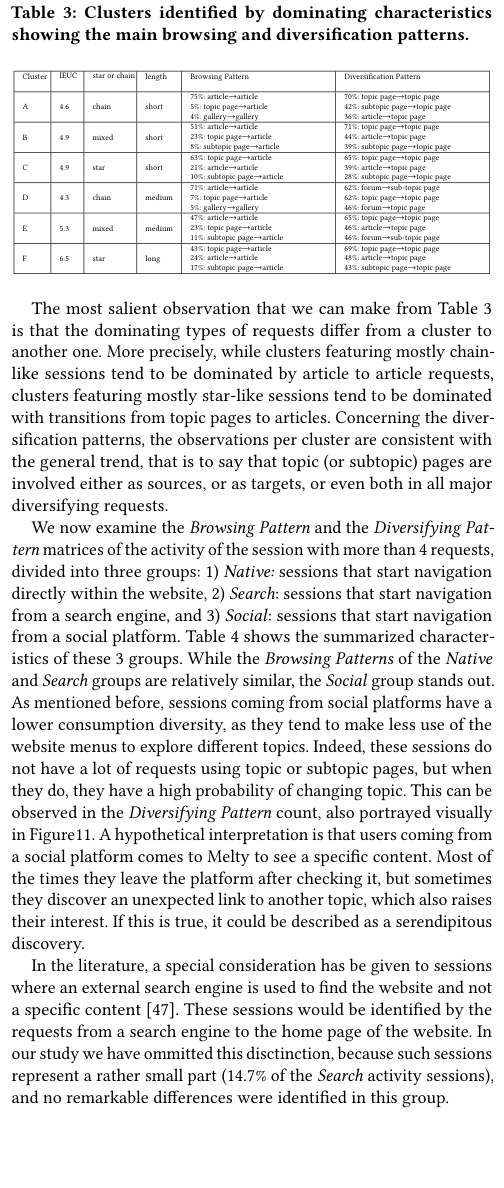
Table 3: Clusters identified by dominating characteristics showing the main browsing and diversification patterns.
Cluster IEUC star or chain length Browsing Pattern Diversification Pattern
75%: article→article 5%: topic page→article 4%: gallery→gallery
70%: topic page→topic page 42%: subtopic page→topic page 36%: article→topic page
A 4.6 chain short
51%: article→article 23%: topic page→article 8%: subtopic page→article
71%: topic page→topic page 44%: article→topic page 39%: subtopic page→topic page
B 4.9 mixed short
63%: topic page→article 21%: article→article 10%: subtopic page→article
65%: topic page→topic page 39%: article→topic page 28%: subtopic page→topic page
C 4.9 star short
71%: article→article 7%: topic page→article 5%: gallery→gallery
62%: forum→sub-topic page 62%: topic page→topic page 46%: forum→topic page
D 4.3 chain medium
47%: article→article 23%: topic page→article 11%: subtopic page→article
65%: topic page→topic page 46%: article→topic page 46%: forum→sub-topic page
E 5.3 mixed medium
43%: topic page→article 24%: article→article 17%: subtopic page→article
69%: topic page→topic page 48%: article→topic page 43%: subtopic page→topic page
F 6.5 star long
The most salient observation that we can make from Table 3 is that the dominating types of requests differ from a cluster to another one. More precisely, while clusters featuring mostly chain- like sessions tend to be dominated by article to article requests, clusters featuring mostly star-like sessions tend to be dominated with transitions from topic pages to articles. Concerning the diver- sification patterns, the observations per cluster are consistent with the general trend, that is to say that topic (or subtopic) pages are involved either as sources, or as targets, or even both in all major diversifying requests.
We now examine the Browsing Pattern and the Diversifying Pat- tern matrices of the activity of the session with more than 4 requests, divided into three groups: 1) Native: sessions that start navigation directly within the website, 2) Search: sessions that start navigation from a search engine, and 3) Social: sessions that start navigation from a social platform. Table 4 shows the summarized character- istics of these 3 groups. While the Browsing Patterns of the Native and Search groups are relatively similar, the Social group stands out. As mentioned before, sessions coming from social platforms have a lower consumption diversity, as they tend to make less use of the website menus to explore different topics. Indeed, these sessions do not have a lot of requests using topic or subtopic pages, but when they do, they have a high probability of changing topic. This can be observed in the Diversifying Pattern count, also portrayed visually in Figure11. A hypothetical interpretation is that users coming from a social platform comes to Melty to see a specific content. Most of the times they leave the platform after checking it, but sometimes they discover an unexpected link to another topic, which also raises their interest. If this is true, it could be described as a serendipitous discovery.
In the literature, a special consideration has be given to sessions where an external search engine is used to find the website and not a specific content [47]. These sessions would be identified by the requests from a search engine to the home page of the website. In our study we have ommitted this disctinction, because such sessions represent a rather small part (14.7% of the Search activity sessions), and no remarkable differences were identified in this group.
Browsing Pattern
a b c d e f ps.
0.7
0.04 X X X 0.21 0.21 0.05
a
0.6
X 0.04 0.15 0.03 0.08 0.28 0.11
b
0.5
0.11 0.11 0.17 0.33 0.11 0.41 0.13
c
0.4
X 0.07 0.51 0.08 0.07 0.51 0.10
d
0.3
0.01 0.04 0.16 0.01 0.06 0.39 0.07
e
X 0.00 0.19 0.11 0.00 0.73 0.10
f
0.2
0.04 0.04 0.17 0.03 0.05 0.59 0.08 0.1
pt.
Diversifying Pattern
(Native)
a b c d e f ps.
0.5
0.02 X X X 0.28 0.32 0.02
a
X 0.03 0.12 0.02 0.05 0.29 0.08
b
0.4
0.14 0.08 0.12 0.31 0.08 0.38 0.09
c
0.3
X X 0.52 0.05 0.03 X 0.07
d
0.00 0.03 0.13 0.01 0.03 0.32 0.04
e
0.2
X 0.00 0.17 X 0.00 0.55 0.05
f
0.02 0.03 0.13 0.02 0.03 0.44 0.05 0.1
pt.
Diversifying Pattern
(Search)
a b c d e f ps.
0.00 X X X X X 0.00
a
0.4
X 0.09 0.10 X 0.10 X 0.12
b
0.3
X X 0.26 X 0.23 X 0.23
c
X X X X X X X
d
0.2
0.00 0.07 0.26 0.00 0.06 0.42 0.06
e
X 0.45 X X 0.00 X 0.13
f
0.1
0.00 0.09 0.23 0.01 0.07 0.46 0.07
pt.
Diversifying Pattern
0.0
(Social)
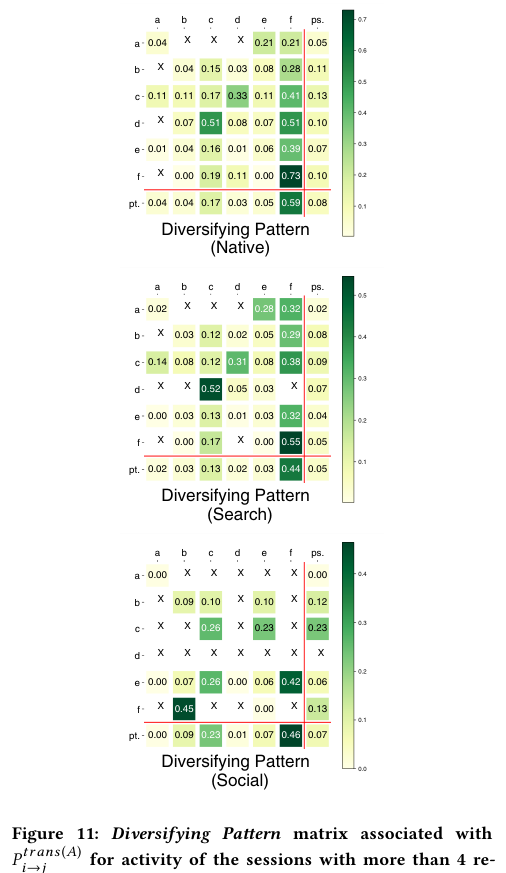
Figure 11: Diversifying Pattern matrix associated with Ptrans(A)
i→j for activity of the sessions with more than 4 re- quests divided in 3 groups: Native activity (top), Search ac- tivity (middle), and Social activity (bottom).
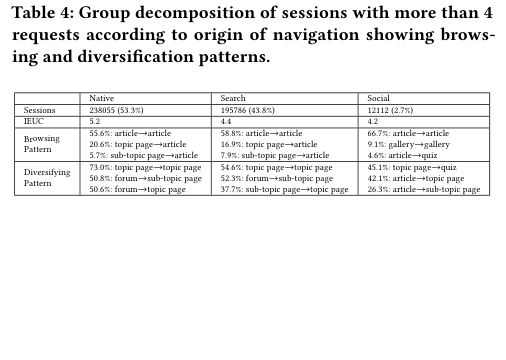
Table 4: Group decomposition of sessions with more than 4 requests according to origin of navigation showing brows- ing and diversification patterns.
Native Search Social Sessions 238055 (53.3%) 195786 (43.8%) 12112 (2.7%) IEUC 5.2 4.4 4.2
55.6%: article→article 20.6%: topic page→article 5.7%: sub-topic page→article
58.8%: article→article 16.9%: topic page→article 7.9%: sub-topic page→article
66.7%: article→article 9.1%: gallery→gallery 4.6%: article→quiz
Browsing Pattern
73.0%: topic page→topic page 50.8%: forum→sub-topic page 50.6%: forum→topic page
54.6%: topic page→topic page 52.3%: forum→sub-topic page 37.7%: sub-topic page→topic page
45.1%: topic page→quiz 42.1%: article→topic page 26.3%: article→sub-topic page
Diversifying Pattern
7 DISCUSSION ABOUT THE STRUCTURE OF THE WEBSITE
In this section, we relate the observations that we have made throughout this work to the structure of Melty website in order to make educated guesses about the navigation behavior of users and how it is influenced by this structure.
As described in Section 3.1, among the hyperlinks which allow to navigate from page to page, an important part of the links on Melty connect topics to subtopics, subtopics to content pages (articles, forums, ...) in a tree-like fashion. These structural links, and the underlying page network structure, accounts for a part of the re- quests constituting browsing paths of users. These are represented in Figure 12 with black arrows.
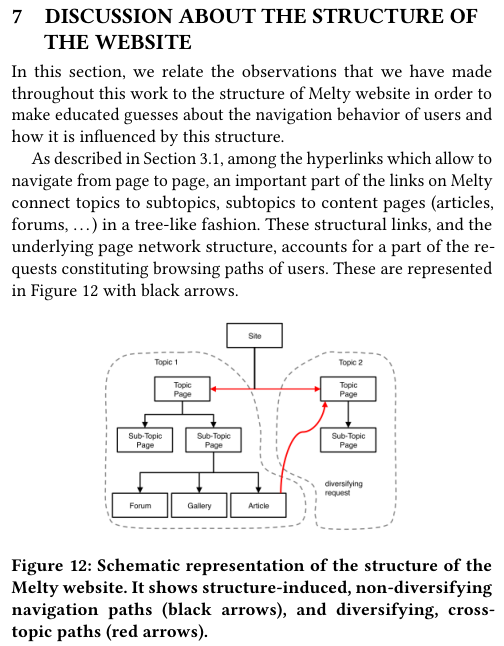
Figure 12: Schematic representation of the structure of the Melty website. It shows structure-induced, non-diversifying navigation paths (black arrows), and diversifying, cross- topic paths (red arrows).
Other links allow more horizontal navigation, for example links anchored in the text of an article, or dynamical recommendation links. While we cannot make a precise count of every kind of links on any article page from our data, it is clear that a large majority of links on a typical article page lead to articles on the same topic and even on the same subtopic. Indeed, the dominating recommender system used on the Melty website (that we cannot describe in details here) favors popularity inside a same topic.
From this description, we can get a better understanding of what we have observed in Section 6. When a session is rather chain-like (as in Cluster A for example), we may assume that the user begins navigation from a topic page, chooses an article, and then follows static links or recommendation links which lead predominantly to other articles of the same topic. It would explain that such sessions are characterized by predominant article to article requests and relatively low diversity. On the other hand, a cluster with higher consumption diversity, like Cluster F, contains longer star-like ses- sions. In this case, users access articles from a topic page, but also other kinds of pages, possibly changing topic in the process. Diver- sification probably occurs mostly at the menu level: either users navigate through the menu bar or they use multi-tabbing.
This analysis gives clues to understand how the navigation be- havior of users is influenced by the structure of the website. In particular, we conjecture that the scarcity of horizontal links, con- necting articles in a given topic to articles in another one, are likely to have a significant impact on the consumption diversity in chain- like sessions.
8 CONCLUSION
In the course of this study we have addressed the issue of the di- versity of browsing paths of sessions over the page network of the information-entertainment website www.melty.fr using server transaction logs. As many other websites, Melty presents a twofold classification of pages, reflecting on the one hand the functional role of a page in the website structure, and on the other hand its type of content. We analyzed three weeks of browsing activity on the website using the server log files. We measured the overall activity in time and grouped the requests in sessions in order to analyze navigation at this scale. Crucially, we evaluated the diversity of the contents consumed by sessions using Shannon entropy. Then, our analysis focused on sessions with more than 4 requests, as it was found to be an appropriate threshold to scrutinize the behavior of users on Melty. It notably showed that sessions originating from so- cial platforms display lower diversity, with larger fluctuations. The measure of aggregated characteristics of the dataset also indicated that pages play a different role in the underlying page network of the website depending on their function category (e.g. topic page or article).
These first results motivated the study of consumed diversity in clusters, based on relevant features of sessions (such as duration or characteristics of the session graphs). These clusters exhibit distinct browsing behaviors, and our analysis revealed that consumption diversity is related to the length and number of requests in a session, but also to the degree to which a session graph is star-like or chain- like. Then, we investigated how the twofold classification of pages is related to these differences in browsing behaviors. Specifically, we measured the functional roles of pages which allow to change topic and thus to diversify consumption. Relating the previous observations to the website design, we could make hypotheses on the likely mechanisms by which users browse the website.
Finally, we made the conjecture that the low-diversity consump- tion which is observed in chain-like sessions may be related to the rarity of links going from an article to another one with a different topic. This final remark is particularly important considering recom- mendation links, and it is what can be leveraged most successfully for the improvement of the consumption diversity. The choice of recommending articles on the same topic is a reasonable design choice, as it guarantees a certain degree of accuracy. This means that users are prone to follow such links. However, it also tends to confine the user in a bubble where exploring diverse contents is much less at hand. Of all requests made by users following horizon- tal links between articles, only 4% of them resulted in a change of topic. This remark is especially relevant in the interaction of bubble- like phenomena between social platforms and website structure. In a social platform, connected users (e.g. friends or followers) can exhibits low diversity in consumption due to homophily, but this lack of diversity can be perpetuated by insufficient availability of diversfying mechanisms in the structure of the websites to which the social browsing leads. In a future work, we consider evaluat- ing experimentally how users react to a greater choice in terms of diversity; in particular, if the website changes the algorithm for rec- ommending related links in article pages, it would be interesting to measure how (and if) the consumed diversity changes with respect to the proposed diversity.
ACKNOWLEDGMENTS
We thank Metly’s team, especially Julien Palard for the access to the data. This work has been funded by the French National Agency of Research (ANR) under grant ANR-15-CE38-0001 (Algodiv).
REFERENCES
[1] Charu C Aggarwal et al. 2016. Recommender systems. Springer. [2] Maristella Agosti, Franco Crivellari, and Giorgio Maria Di Nunzio. 2012. Web log
analysis: a review of a decade of studies about information acquisition, inspection and interpretation of user interaction. Data Mining and Knowledge Discovery 24, 3 (2012), 663–696. [3] Lalit R Bahl, Frederick Jelinek, and Robert L Mercer. 1983. A maximum likelihood
approach to continuous speech recognition. IEEE Transactions on Pattern Analysis & Machine Intelligence 2 (1983), 179–190. [4] Pablo Barberá, John T Jost, Jonathan Nagler, Joshua A Tucker, and Richard
Bonneau. 2015. Tweeting from left to right: Is online political communication more than an echo chamber? Psychological science 26, 10 (2015), 1531–1542. [5] Christian Bomhardt, Wolfgang Gaul, and Lars Schmidt-Thieme. 2005. Web robot
detection-preprocessing web logfiles for robot detection. In New developments in classification and data analysis. Springer, 113–124. [6] Abdelhamid Salah Brahim, Lionel Tabourier, and Bénédicte Le Grand. 2013. A
data-driven analysis to question epidemic models for citation cascades on the blogosphere. In 7th International AAAI Conference on Weblogs and Social Media. [7] Ulrik Brandes. 2001. A faster algorithm for betweenness centrality. Journal of
mathematical sociology 25, 2 (2001), 163–177. [8] Hui-Min Chen and Michael D Cooper. 2001. Using clustering techniques to detect
usage patterns in a Web-based information system. Journal of the American Society for Information Science and Technology 52, 11 (2001), 888–904. [9] Min Chen and Young U Ryu. 2013. Facilitating effective user navigation through
website structure improvement. IEEE Transactions on Knowledge and Data Engi- neering 25, 3 (2013), 571–588. [10] Ed H Chi, Peter Pirolli, and James Pitkow. 2000. The scent of a site: A system for
analyzing and predicting information scent, usage, and usability of a web site. In Proceedings of the SIGCHI conference on Human Factors in Computing Systems. ACM, 161–168. [11] Dimitar Dimitrov, Philipp Singer, Florian Lemmerich, and Markus Strohmaier.
What makes a link successful on wikipedia?. In Proceedings of the 26th International Conference on World Wide Web. International World Wide Web Conferences Steering Committee, 917–926. [12] Derek Doran and Swapna S Gokhale. 2011. Web robot detection techniques:
overview and limitations. Data Mining and Knowledge Discovery 22, 1-2 (2011), 183–210. [13] Nathan Eagle, Michael Macy, and Rob Claxton. 2010. Network diversity and
economic development. Science 328, 5981 (2010), 1029–1031. [14] Seth Flaxman, Sharad Goel, and Justin M Rao. 2016. Filter bubbles, echo chambers,
and online news consumption. Public opinion quarterly 80, S1 (2016), 298–320. [15] Daniel Fleder and Kartik Hosanagar. 2009. Blockbuster culture’s next rise or fall:
The impact of recommender systems on sales diversity. Management science 55, 5 (2009), 697–712. [16] Yongjian Fu, Ming-Yi Shih, Mario Creado, and Chunhua Ju. 2002. Reorganizing
web sites based on user access patterns. Intelligent Systems in Accounting, Finance & Management 11, 1 (2002), 39–53. [17] Joris Guérin, Olivier Gibaru, Stéphane Thiery, and Eric Nyiri. 2017. Clustering
for different scales of measurement-the gap-ratio weighted k-means algorithm. arXiv preprint arXiv:1703.07625 (2017). [18] Aaron Halfaker, Oliver Keyes, Daniel Kluver, Jacob Thebault-Spieker, Tien
Nguyen, Kenneth Shores, Anuradha Uduwage, and Morten Warncke-Wang. 2015. User session identification based on strong regularities in inter-activity time. In Proceedings of the 24th International Conference on World Wide Web. 410–418. [19] Denis Helic, Markus Strohmaier, Michael Granitzer, and Reinhold Scherer. 2013.
Models of human navigation in information networks based on decentralized search. In Proceedings of the 24th Conference on Hypertext and Social Media. ACM, 89–98. [20] Bernard J Jansen. 2008. Handbook of research on web log analysis. IGI Global. [21] Rosie Jones and Kristina Lisa Klinkner. 2008. Beyond the session timeout: auto-
matic hierarchical segmentation of search topics in query logs. In Proceedings of the 17th Conference on Information and Knowledge Management. ACM, 699–708. [22] Juhi Kulshrestha, Muhammad Bilal Zafar, Lisette Espin Noboa, Krishna P Gum-
madi, and Saptarshi Ghosh. 2015. Characterizing Information Diets of Social Media Users. In 9th International AAAI Conference on Web and Social Media. [23] Amaury L’Huillier, Sylvain Castagnos, and Anne Boyer. 2016. Modéliser la
diversité au cours du temps pour détecter le contexte dans un service de musique en ligne. Revue des Sciences et Technologies de l’Information (2016). [24] Haibin Liu and Vlado Kešelj. 2007. Combined mining of Web server logs and web
contents for classifying user navigation patterns and predicting users’ future
requests. Data & Knowledge Engineering 61, 2 (2007), 304–330. [25] Ray McAleese. 1989. Navigation and browsing in hypertext. Hypertext: theory
into practice (1989), 6–44. [26] Sharon McDonald and Rosemary J Stevenson. 1998. Navigation in hyperspace:
An evaluation of the effects of navigational tools and subject matter expertise on browsing and information retrieval in hypertext. Interacting with computers 10, 2 (1998), 129–142. [27] Alan L Montgomery and Christos Faloutsos. 2001. Identifying web browsing
trends and patterns. Computer 34, 7 (2001), 94–95. [28] Tien T Nguyen, Pik-Mai Hui, F Maxwell Harper, Loren Terveen, and Joseph A
Konstan. 2014. Exploring the filter bubble: the effect of using recommender systems on content diversity. In Proceedings of the 23rd international conference on World wide web. ACM, 677–686. [29] David Nicholas, Paul Huntington, and Hamid R Jamali. 2008. User diversity: as
demonstrated by deep log analysis. The Electronic Library 26, 1 (2008), 21–38. [30] David Nicholas, Paul Huntington, and Anthony Watkinson. 2005. Scholarly
journal usage: the results of deep log analysis. Journal of documentation 61, 2 (2005), 248–280. [31] Dimitar Nikolov, Diego FM Oliveira, Alessandro Flammini, and Filippo Menczer.
Measuring online social bubbles. PeerJ Computer Science 1 (2015), e38. [32] Adrien Nouvellet, Florence D’Alché-Buc, Valérie Baudouin, Christophe Prieur,
and François Roueff. 2019. Discovery of usage patterns in digital library web logs using Markov modeling. Preprint. https://hal.archives-ouvertes.fr/hal-02182244 [33] Lukasz Olejnik, Claude Castelluccia, and Artur Janc. 2012. Why johnny can’t
browse in peace: On the uniqueness of web browsing history patterns. In 5th Workshop on Hot Topics in Privacy Enhancing Technologies (HotPETs 2012). [34] Ashwin Paranjape, Robert West, Leila Zia, and Jure Leskovec. 2016. Improving
website hyperlink structure using server logs. In Proceedings of the Ninth ACM International Conference on Web Search and Data Mining. ACM, 615–624. [35] Eli Pariser. 2011. The filter bubble: What the Internet is hiding from you. Penguin
UK. [36] Thomas A Peters. 1993. The history and development of transaction log analysis.
Library hi tech 11, 2 (1993), 41–66. [37] Huy Pham, Cyrus Shahabi, and Yan Liu. 2013. EBM: an entropy-based model to
infer social strength from spatiotemporal data. In Proceedings of the 2013 ACM SIGMOD International Conference on Management of Data. ACM, 265–276. [38] Francesco Ricci, Lior Rokach, and Bracha Shapira. 2015. Recommender systems:
introduction and challenges. In Recommender systems handbook. Springer, 1–34. [39] Aju Thalappillil Scaria, Rose Marie Philip, Robert West, and Jure Leskovec. 2014.
The last click: Why users give up information network navigation. In Proceedings of the 7th ICWSDM Conference. ACM, 213–222. [40] Ana Lucía Schmidt, Fabiana Zollo, Michela Del Vicario, Alessandro Bessi, Antonio
Scala, Guido Caldarelli, H Eugene Stanley, and Walter Quattrociocchi. 2017. Anatomy of news consumption on Facebook. Proceedings of the National Academy of Sciences 114, 12 (2017), 3035–3039. [41] Craig Silverstein, Hannes Marais, Monika Henzinger, and Michael Moricz. 1999.
Analysis of a very large web search engine query log. In ACM SIGIR Forum, Vol. 33. ACM, 6–12. [42] Ramakrishnan Srikant and Yinghui Yang. 2001. Mining web logs to improve
website organization. WWW 1 (2001), 430–437. [43] Dick Stenmark. 2008. Identifying clusters of user behavior in intranet search
engine log files. Journal of the American Society for Information Science and Technology 59, 14 (2008), 2232–2243. [44] Andrew Stirling. 1998. On the economics and analysis of diversity. Science Policy
Research Unit (SPRU), Electronic Working Papers Series, Paper 28 (1998), 1–156. [45] Andy Stirling. 2007. A general framework for analysing diversity in science,
technology and society. Journal of the Royal Society Interface 4, 15 (2007), 707–719. [46] Pang-Ning Tan and Vipin Kumar. 2004. Discovery of web robot sessions based
on their navigational patterns. In Intelligent Technologies for Information Analysis. Springer, 193–222. [47] Michele Trevisiol, Luca Maria Aiello, Rossano Schifanella, and Alejandro Jaimes.
Cold-start news recommendation with domain-dependent browse graph. In Proceedings of the 8th ACM Conference on Recommender systems. ACM, 81–88. [48] Saúl Vargas and Pablo Castells. 2011. Rank and relevance in novelty and diversity
metrics for recommender systems. In Proceedings of the fifth ACM conference on Recommender systems. ACM, 109–116. [49] Simon Wakeling and Paul Clough. 2016. Determining the Optimal Session
Interval for Transaction Log Analysis of an Online Library Catalogue. In European Conference on Information Retrieval. Springer, 703–708. [50] Robert West and Jure Leskovec. 2012. Human wayfinding in information net-
works. In Proceedings of the 21st international conference on World Wide Web. ACM, 619–628. [51] Dietmar Wolfram. 2008. Search characteristics in different types of Web-based
IR environments: Are they the same? Information processing & management 44, 3 (2008), 1279–1292. [52] Tao Zhou, Zoltán Kuscsik, Jian-Guo Liu, Matúš Medo, Joseph Rushton Wakeling,
and Yi-Cheng Zhang. 2010. Solving the apparent diversity-accuracy dilemma of recommender systems. PNAS 107, 10 (2010), 4511–4515.
Do you like what you are reading? Subscribe to receive updates.
Unsubscribe anytime