
Adaptive Navigational Support and Explainable Recommendations in a Personalized Programming Practice System
Jordan Barria-Pineda (University of Pittsburgh, Pittsburgh, USA, jab464@pitt.edu), Kamil Akhuseyinoglu (University of Pittsburgh, Pittsburgh, USA, kaa108@pitt.edu), Peter Brusilovsky (University of Pittsburgh, Pittsburgh, USA, peterb@pitt.edu)
Published in HT '23: 34th ACM Conference on Hypertext and Social Media · DOI: 10.1145/3603163.3609054 · License: © Copyright held by the owner/author(s). Publication rights licensed to ACM.
Keywords: adaptive navigation support, educational recommender systems, explainability, transparency
Session: Social and Intelligent Media: Social media methods
Abstract
We present the results of a study where we provided students with textual explanations for learning content recommendations along with adaptive navigational support, in the context of a personalized system for practicing Java programming. We evaluated how varying the modality of access (no access vs. on-mouseover vs. on-click) can influence how students interact with the learning platform and work with both recommended and non-recommended content. We found that the persistence of students when solving recommended coding problems is correlated with their learning gain and that specific student-engagement metrics can be supported by the design of adequate navigational support and access to recommendations’ explanations.
Ccs Concepts
• Human-centered computing →Empirical studies in HCI; Hypertext / hypermedia; • Information systems →Personalization.
Keywords
adaptive navigation support, educational recommender systems, explainability, transparency
1 INTRODUCTION
Over the last 20 years, the Computer Science Education community has developed and tested a large variety of advanced tools to support teaching and learning programming. These tools frequently referred to as interactive or “smart” learning content [4] include a variety of “worked example” tools (annotated examples [15], code animations [31], codecasts [30]) focused on communicating code
Peter Brusilovsky University of Pittsburgh Pittsburgh, USA peterb@pitt.edu
understanding and code construction knowledge to the learners and various types of automatically assessed problems (code tracing problems [6], Parson’s problems [27], coding problems [17]) engaging students in applying and mastering this knowledge. While some types of smart content are used for assessment purposes (i.e., labs, exams, and homework assignments) more and more frequently, collections of smart content are released for students in a free practice mode, i.e., something that they can do in their spare time for self-study and self-assessment. The availability of free practice content is becoming increasingly important to support learning programming due to the increased numbers and diversity of students enrolled in programming courses. For most less-prepared students, mandatory class activities such as labs and assignments offer too few practice opportunities to learn complex programming concepts. In contrast, free practice content opens an opportunity for everyone to practice as much as necessary to achieve mastery while also focusing on the most important or least studied topics. Unfortunately, it becomes increasingly harder for less-prepared students to efficiently use this opportunity due to rapidly increasing volumes of available smart content. Large collections of smart content are now frequently provided by the publishers as additions to programming textbooks 1 or embedded into online interactive textbooks [11, 29]. Moreover, a number of dedicated practice systems were developed to provide access to large volumes of interactive examples and problems [5, 12, 22]. Faced with these large volumes of available practice content, lessprepared students lack sufficient domain knowledge to choose the most appropriate content for their practice, which due to the known paradox of choice, decreases their engagement in practice [18]. This paper argues that the increasing volumes of smart learning content should be balanced by the availability of personalized support helping each learner to find practice content that is most relevant to their current needs and level of knowledge. We present a personalized programming practice system (𝐽𝑃3) that attempts to guide each student to the most appropriate practice through adaptive navigation support and explainable content recommendation. The paper presents the implementation of these technologies in programming practice content and reviews the results of a semesterlong classroom study to assess the impact of these technologies on student work with smart content. Among other issues, our study was designed to assess the added value of explanations, a new technology that is applied to increase the understandability and acceptance of recommendations.
1https://www.wiley.com/learn/horstmann/
2 RELATED WORK Adaptive navigation support [3] is a group of technologies that adapt the presentation of links on hypertext or hypermedia pages in order to guide users to the most relevant information. Among a range of link adaptation approaches such as ranking, generating, or disabling links, adaptive link annotation emerged as the most popular and efficient in educational hypermedia [7]. This technology attempts to augment links with personalized visual cues (i.e., color, font, icons, comments) to express why a specific link could be relevant or not relevant to the learner at the given moment [7]. For example, progress-based navigation support could visualize the estimated amount of knowledge acquired by the learner on a specific topic or content item [26] guiding learners to topics less studied. Prerequisite-based navigation support stresses the presence or absence of knowledge of prerequisite concepts [13] helping students to avoid content for which they do not have sufficient prerequisite knowledge. Content recommendation, another popular approach to guide learners to the most relevant content in educational systems [10], could be considered as an alternative to adaptive navigation support. It does generate a ranked list of relevant content; however, it does not make clear why a specific recommended content might be relevant to the learner [19, 21]. To date, the Recommender Systems research community has an extensive body of work on how to provide users with information about why certain items have been recommended to them in several domains (e.g. music recommendations [24], artwork recommendations [23]). In this context, Tintarev and Masthoff presented a framework to design and evaluate these explanations for recommendations [32]. Multiple benefits have been found from adding explanations to recommender systems, e.g., the increase in users’ trust in the system, the increment of recommendations’ persuasiveness, and higher levels of user satisfaction. Notwithstanding the above, this focus has not been replicated to the same extent in the educational recommender systems community, where the focus has been kept mainly on the usefulness of the recommendations more than the effect that these have on students’ adoption and their overall behavior within online learning platforms. Recently some promising work has begun to fill this gap [1, 25], demonstrating that explanatory features for learning content recommendations can influence students’ attitudes towards their adoption. Finally, and in parallel with these efforts, the Artificial Intelligence in Education (AIED) community has increased its attention to explanations in AI-based educational systems, proposing some unique learning-related metrics associated with explainable systems, such as students’ agency of their own learning [20].
3 PERSONALIZED PRACTICE SYSTEM:
GUIDING STUDENTS THROUGH A MAZE OF SMART CONTENT
The 𝐽𝑃3 system is an online learning platform that provides personalized access to different types of online learning activities to practice Java programming. It augments students with several features that allow them to navigate through the learning content (152 activities in total) in a personalized way.
3.1 Access to Learning Content and Adaptive Navigation Support
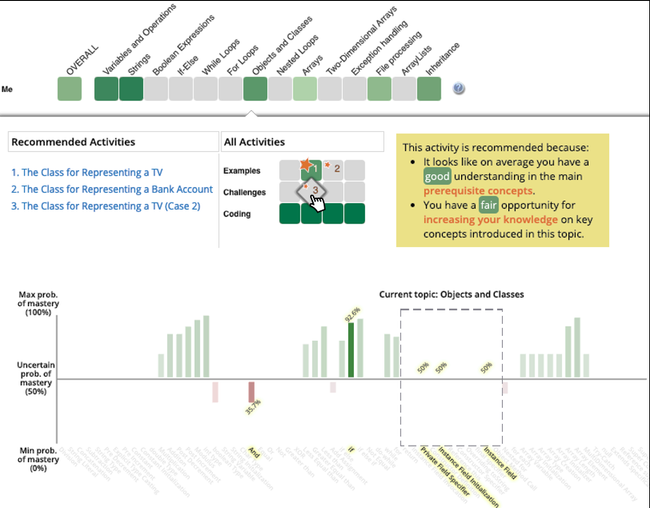
The learning content provided by the system is organized by topic (see the upper part of Fig.1) reflecting the topic structure of the course. Once the student clicks on one of the topic cells, the system opens access to learning activities for this topic, presented as content cells and arranged by activity type, one on each row. The three available types of learning activities include (1) Worked examples (2) Challenges, simple problems where students need to complete missing lines of a code to solve a problem[16]; and (3) Coding problems, where solution code should be written from scratch. To help students in selecting the best activities for the current state of their knowledge, the system provides adaptive navigation support, direct recommendation, and explanation of recommendations. The progress-based navigation support is provided by the intensity of green-color filling of the topic and content cells. The darker the color is, the more work has been done with corresponding activities or whole topics. The gray color indicates topics and activities not yet attempted by the student. In addition, a combination of goal-based and prerequisite-based navigation support is provided when the student mouses over each activity cell. To provide this support, the system uses a concept-based open learner model (OLM) shown at the bottom of Fig. 1. The OLM visually presents the state of learner knowledge for each Java concept using the progress bar. When the mouse cursor is placed over an activity cell, the system highlights all concepts associated with this activity. Target concepts for the current topic are shown inside the dashed rectangle, while prerequisite concepts (i.e., concepts that were studied in earlier topics, but required to work with the selected problem) are shown to the left of this rectangle. This visual navigation support helps students to assess the state of the prerequisite knowledge for the selected problem as well as to see how much it contributes to learning the target concepts. While navigation support is valuable for decision-making, it could be still hard for less-prepared students to select the best activity. To address these needs, 𝐽𝑃3 directly recommends the three best problems with an optimal balance of prerequisite and target concepts. Recommendations are shown on the left of the activity cells. Also, a cell corresponding to the recommended content is marked with a red star. To provide further help with recommended content, the system generates textual explanations for each recommended example or problem. The explanation is displayed when the student places the mouse cursor over the recommended problem. No mouseover explanation is provided for non-recommended problems, although navigation support is shown for all problems, recommended or not.
3.2 Student Modeling and Explainable Recommendations
Student Modeling: The ability to model a student’s current level of knowledge for every domain concept or topic is the foundation of all personalization power in 𝐽𝑃3. In contrast to Bayesian knowledge tracing [9] used in the majority of personalized learning systems, 𝐽𝑃3 using more complex Bayesian network approach [8] to update mastery estimation of Java programming concepts after each learner’s interaction with learning content (either correct or
Table 1: Rules for generating explanations for educational recommendations
Verbal explanation template for prerequisite concepts | θ̄p ≥ .6 | θ̄p ≥ .75 | θ̄p ≥ .95 |
|---|---|---|---|
It looks like on average, you have a … understanding in the main prerequisite concepts. | good | proficient | excellent |
Verbal explanation template for target concepts | θ̄t ≤ .6 | θ̄t ≤ .4 | θ̄t ≤ .2 |
|---|---|---|---|
You have a … opportunity for increasing your knowledge on key concepts introduced in this topic. | fair | good | excellent |
incorrect). The parameters of the Bayesian Network are trained using student data from previous Java programming courses. More details on Bayesian student modeling in 𝐽𝑃3 could be found in [14]. Recommendation approach: The key idea of 𝐽𝑃3 content recommendations algorithm is balancing the amount of prerequisite knowledge that learners need to solve/understand the activity and the amount of new knowledge that they can acquire while working with it [2]. In this context, a desired case (high recommendation score) would be a learning activity where the student has a high average mastery level on the prerequisite concepts (i.e., ready to attempt) and a low average mastery level on the outcome concepts (i.e., good opportunity for knowledge gain). The algorithm uses the concept knowledge estimations from the Bayesian student model and scores the learning activities by following these rules: (a) only non-completed content is recommended; (b) worked examples have priority over problems when they introduce a concept that has not been practiced previously; (c) for problems, a score is calculated using the Equation 1,
Equation 1. rec scoreᵢⱼ = (1 / N W) (Σₚ wₚ × θₚⱼ + Σₜ wₜ × (1 − θₜⱼ)) where p denotes the prerequisite concepts and t represents the outcome concepts associated with content i. 𝜃𝑝𝑗and 𝜃𝑡𝑗are the knowledge estimations of learner j for both concept categories. 𝑤 represents the topic-level importance of the concepts (either 𝑝or 𝑡) calculated by using tf-idf (i.e., the more unique a concept in a topic, the higher its importance), and 𝑊is the sum of the weights for the associated concepts (both prerequisite and outcome ones). Finally, 𝑁denotes the number of concepts associated with activity i. Learning activities within the topic are sorted based on these scores and the top-3 items are recommended to the learner. Explanations’ generation: Textual explanations in 𝐽𝑃3 attempt to make more transparent why the algorithm judged the recommended activity as a good choice given the current knowledge level of the student. To generate an explanation for a problem, we average the knowledge estimations for the top three prerequisite and outcome concepts ( ¯𝜃𝑝and ¯𝜃𝑡). and use it to generate short paragraphs for the prerequisite and outcome parts of the explanations. Table 1 presents samples of textual explanations for several thresholds. The thresholds and wording were selected to offer a simplified qualitative explanation of numerical values used in the recommendation process. A recommended example was justified by stating that “it presents concept(s) that are new to you (e.g. conceptname)”.
4 THE CLASSROOM STUDY 4.1 Participants
The subjects of the classroom study were college students taking an introductory programming course in Java at a public US university. Students were offered a 1% of extra credit for taking the
pre-test, another 1% for taking the post-test and post-questionnaire, and finally, another 1% for completing a minimum threshold of activity within the system. This threshold was completing 2 coding problems, out of many available, for each topic. A total of 208 students were enrolled in the different sections of the class, but given the non-mandatory nature of the system’s usage, we ended up having only 67 “active students” in the system. In the context of the study, we define “active students” as learners that attempted at least two coding problems. We chose that as the minimum threshold of meaningful activity after examining the skewed distribution of attempts and after identifying that a big proportion of students attempted only one or two activities. After removing them, the distribution resembled a normal shape.
4.2 Procedure
At the beginning of the study, we collected informed consent forms and administered a 10-question pretest to measure students’ starting level of knowledge in Java programming. Following that, 𝐽𝑃3
was introduced to the students and they were invited (but not required) to use the system to practice Java topics as they progress through them in the class. The system was available for the students for the whole duration of the course. At the end of the semester, we administered the same set of 10 questions as a post-test to measure students learning. In addition, we administered a questionnaire to collect student feedback about the system, its recommendations, as well as the understandability and usefulness of the navigational support and explanations. The questionnaire was created by combining questions from several questionnaires for evaluating recommender systems [28] and explanations of recommendations [24].
4.3 Control and Treatments
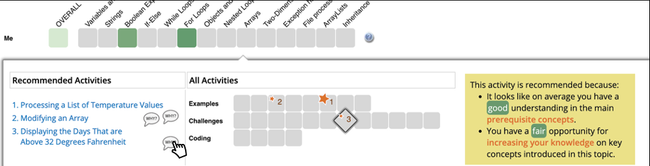
To assess the added value of explanations for content recommendations, we randomly split students into three groups. The examination of pre-test results confirmed that there were no significant differences between groups, i.e., the students had a similar level of knowledge about Java programming at the beginning of the study. All groups had access to OLM, navigation support and recommendations, but differed in their access to textual explanations. The no-exp group worked with a version of 𝐽𝑃3 with disabled textual explanations. The exp-on-mouseover group has standard access to explanations, i.e., it received textual explanations of recommendations when performing mouseovers on recommended activities (in addition to visual navigation support). The exp-on-click group received explanations by clicking on icon “Why?” attached to each recommended activity in the ranked list (Figure 2). In this group, just like in no-exp group only visual navigation support was provided through mouseovers on recommended activities. The reason to introduce the exp-on-click group was our attempt to separate the presentation of explanation and the presentation of navigation
Figure 1: Version of 𝐽𝑃3 that includes content recommendations (shown as stars) , an Open Learner Model which shows the estimated knowledge of students at a conceptual level, and textual explanations that explain why recommendations were generated.
support. Indeed, from the logs produced by exp-on-mouseover group is not clear whether a mouseover was performed to examine navigation support or textual explanations and whether the duration of the mouseover indicates examination of explanation or navigation support information. In contrast, in the logs of exp-on-click group make it clear which information was requested by students and how long it was studied.
5 RESULTS 5.1 Access to Navigation Support and Explanations
The usage of the navigational support features and textual explanation access in exp-on-mouseover group could be assessed by examining the average frequency and duration of the mouseover on learning activities. The mouseover data were pre-processed by removing mouseovers with a duration of less than a second. Data analysis indicated that a large number of short mouseovers were logged when students moved the cursor from one area of the interface to another, and including them would add noise to the analysis. By considering “long mouseovers” only, we made sure
Figure 2: Version of 𝐽𝑃3 where textual explanations for recommendations of learning content are shown when students click on the “Why?” icon.
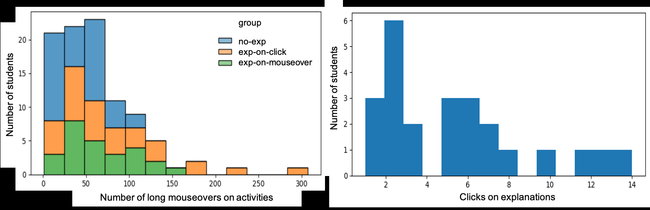
that we keep the interactions that most likely reflect student access and examination of navigation support visualization (and textual explanation in the exp-on-mouseover group). In the same way, we removed mouseovers that were too long (over 10 seconds, based on mouseover duration distribution). The left side of Figure 3, shows that students performed a large number of long mouseovers on activity cells in all three groups (𝑀𝑒𝑑𝑛𝑜−𝑒𝑥𝑝= 40,𝑀𝑒𝑑𝑒𝑥𝑝−𝑜𝑛−𝑐𝑙𝑖𝑐𝑘= 60,𝑀𝑒𝑑𝑒𝑥𝑝−𝑜𝑛−𝑚𝑜𝑢𝑠𝑒𝑜𝑣𝑒𝑟= 57). This data indicate extensive use of navigation support functionalities. We also detected significant differences in the total number of mouseovers among the three groups by performing a Kruskal test (𝑝= .03). When checking pairwise differences among groups using Dunn’s test with Holm correction, only marginal differences were found between the control group and both treatment groups (𝑝= .06), which shows that overall, students with access to textual explanations performed more exploration through long mouseovers. We also calculated students’ engagement with textual explanations in the exp-on-click group, measured through the number of clicks on the “Why?” icon (see Figure 2). The right side of Figure 3 shows that users did use textual explanations – the median of clicks of explanations is 5. We also found that all active students in expon-click group clicked on the explanations icon at least once, i.e., all students in that group were exposed to textual explanations.
5.2 Adaptive Navigation Support, Recommendations, and Exploration of Learning Content
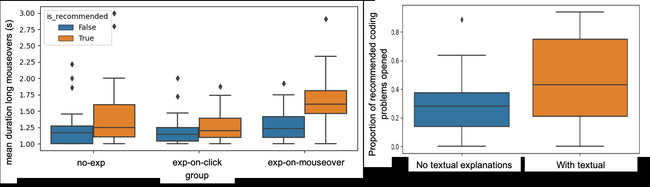
Through the navigation support, 𝐽𝑃3 allowed students to explore learning content in two different ways. First, they can use mouseovers to examine the potential relevance of content to their knowledge. Second, they can open an activity and examine its relevance directly. In this section, we explore whether recommended problems received more attention from students in the exploration process. We started by examining the differences between the duration of the mouseovers on recommended and non-recommended activities (Figure 4 left). The Figure shows that students generally pay more attention to the exploration of recommended problems. After running a Mann-Withney U test on the mean difference in the duration of long mouseovers between recommended and non-recommended content per group, we found that only in the exp-on-mouseover group students, in fact, spent more time (in average) when mousing over recommended activities compared with non-recommended ones (𝑝𝑒𝑥𝑝−𝑜𝑛−𝑚𝑜𝑢𝑠𝑒𝑜𝑣𝑒𝑟= 0.0001,𝑈= 510). This result suggests that students in the exp-on-mouseover took some considerable time to examine the textual explanations which were shown to this group on mouseover only for recommended problems, in parallel with navigation support information. Next, we examined significant differences in the percentage of the total opened activities that were recommended (see Fig.4 right). Here we combined the two treatment groups, as for the exp-on-click all students clicked at least one explanation, so all of them were exposed to the existence of textual explanations within the 𝐽𝑃3
system (combined group exp). We found that for coding problems, the proportion of open problems which were recommended in the treatment groups was significantly higher than the no-exp group
(𝑀𝑒𝑑𝑛𝑜𝑒𝑥𝑝= .28,𝑀𝑒𝑑𝑒𝑥𝑝= .43,𝑈= 340,𝑝= .039) –the same result did not hold for challenge problems. This result reflects that students who had access to textual explanations were more eager to open recommended problems (15% difference) compared to the students that did not have access to explanations.
5.3 Adaptive Navigation Support and Engagement with Learning Content
While exploration activity reflects students’ interest in learning content it is the engagement with the activities that truly matter. This section examines whether access to textual explanations affected the willingness of students to work on the practice content provided by the system, i.e., are there engagement differences between exp-on-mouseover and exp-on-click groups that had access to textual explanations and no-exp group that did not have access to them. Again, the groups that had access to textual explanations were merged into group exp to examine statistical differences. We found no differences in attempts on coding problems, however, we found significant differences for challenge problems in coverage, the percentage of total activities that were attempted (𝑀𝑒𝑑𝑛𝑜𝑒𝑥𝑝= 7%,𝑀𝑒𝑑𝑒𝑥𝑝= 12%,𝑝= .001,𝑈= 430). Furthermore, when checking for coverage of attempts on “hard” challenge problems (topics in the second half of the course) the difference becomes a bit larger (𝑀𝑒𝑑𝑛𝑜𝑒𝑥𝑝= 5%,𝑀𝑒𝑑𝑒𝑥𝑝= 13%), but marginally significant (𝑝= .057,𝑈= .057). In order to examine the association between the usage of navigation support features within the 𝐽𝑃3 system and their work with the learning content in more detail, we ran a series of multivariate linear regression models to try to predict the conversion and persistence values of students when working on both recommended and non-recommended problems. Before fitting the regressions, we divided the data in a different way: into two groups given the different nature of the mouseovers on the different groups, i.e. expon-mouseover group students had access to textual explanations when mousing over the recommended content while the other two groups did not have access to that. Thus, we combined these last two groups into one, (from now on no-exp-on-mouseover), which includes the control group and the exp-on-click treatment group. The independent variables that we considered were: • Mean duration of long mouseovers for both recommended and non-recommended activities. • Number of long mouseovers for both recommended and non-recommended activities. • Clicks on explanations for group exp-on-click. • Proportions of mean duration and frequency of long mouseovers on recommended activities relative to the values of the nonrecommended ones. We followed a stepwise regression schema when fitting the regression models and we made sure the independent variables of the final models were not highly correlated (VIF<2.5). The dependent student engagement-related metrics that we examined from the logs of activity, both associated with the recommendations’ persuasiveness dimension presented in [32], were the following: • Conversion rate: Proportion of the problems that were opened and attempted at least once (range: 0 to 1).
Figure 3: Left: Distribution of the number of long mouseovers on activities per group. Right: Distribution of the number of clicks that triggered the display of textual explanations on exp-on-click group
• Persistence rate: Proportion of the problems that were attempted at least ones in which the student kept working on them until solving them correctly, i.e., submitting a correct answer (range: 0 to 1).
5.3.1 Without textual explanations on mouseover. Conversion rate: For no-exp-on-mouseover students, the conversion rate on recommended problems (𝑝= .018,𝑑𝑓= 38,𝑎𝑑𝑗𝑢𝑠𝑡𝑒𝑑𝑅2 = .15) was found marginally correlated with pretest (𝑝= .06, 𝛽= .01) and significantly correlated with the proportion of long mouseovers on recommended problems relative to non-recommended ones (𝑝= 027, 𝛽= .45). This shows the tendency that better-prepared students are more confident in working on recommended problems and that the more long-mouseovers they perform on recommended problems make them more willing to work on them. On the other hand, we found that students’ conversion rate on nonrecommended problems (𝑝= .0001,𝑑𝑓= 36,𝑎𝑑𝑗𝑢𝑠𝑡𝑒𝑑𝑅2 = .39) is also positively correlated with the pretest (𝑝= 0.027,𝛽= .01) and mean duration of long mouseovers on recommended problems (𝑝= .001,𝛽= 0.17). In this case, we see the same effect on students’ pre-existent knowledge and possibly longer mouseover times reflect doubt of students on trying the recommended problems, which gets
reflected in higher conversion rates for non-recommended problems.
Persistence rate: For recommended problems, we did not find any significant model to explain their persistence rate based on students’ navigational behavior on the system. Regarding non-recommended problems, the pretest was again found as a significant predictor of the persistence of students’ work on non-recommended problems (𝑝= .037,𝛽= .024). Additionally, this was the only descriptor of students’ work that was found to be correlated with students’ clicks on explanations. In this context, the more they access textual explanations (through clicks), the lower their persistence on nonrecommended problems (𝑝= .01,𝛽= −.04). Also, the more students mouse over on recommended problems the less persistent they are when working on the non-recommended ones (𝑝= .059,𝛽= −.005).
5.3.2 With textual explanations on mouseover. Conversion rate: In the exp-on-mouseover group (𝑝= .04,𝑑𝑓= 18,𝑎𝑑𝑗𝑢𝑠𝑡𝑒𝑑𝑅2 = .16), we observed a significant negative correlation between the number of long mouseovers on non-recommended activities and the conversion rate on recommended problems. This could be interpreted as the more the students use the navigational
Figure 4: Left: Distribution of the mean duration of long mouseovers on each of the groups, for both recommended and non-recommended learning content (exp-on-mouseover). Right: Difference in proportion of opened coding problems that were recommended between no-exp and treatment groups
features to explore the non-recommended options for them, the less encouraged they felt for attempting the recommended problems they opened as a reflection of that exploratory behavior. On the other hand, for exp-on-mouseover students, we did not find any significant behavioral pattern that could explain their conversion rate on non-recommended problems.
Persistence rate: For the exp-on-mouseover students, we found a marginally significant regression model (𝑝= .09,𝑑𝑓= 16,𝑎𝑑𝑗𝑢𝑠𝑡𝑒𝑑𝑅2 = 0.19) which reflects that there is a positive correlation between the average duration of mouseovers on non-recommended problems (𝑝= .03,𝛽= .86) and their probability of solving recommended problems once they started working on them (i.e., submitting a solution). Through the model, we also found that the proportion of the frequency of mouseovers on recommended problems relative to non-recommended problems is positively correlated with their persistence in solving recommended content (𝑝= .07,𝛽= 1.07). Finally, the proportion of the duration of the mouseovers on recommended problems relative to non-recommended ones was also found positively correlated to (𝑝= 0.029, 𝛽= 0.7). This model reflects that there is a tendency that the longer and more frequent student mouseovers on recommended content (in comparison with non-recommended problems), the more likely is that they are persistent on those recommended problems they work on. On the other hand, the longer the exploration of non-recommended ones increases the likeliness of persistent work on the recommended ones, which could be taken as a sign of students’ reflecting on how appropriate is the recommended content for them by contrasting them with the non-suggested ones. For non-recommended problems, the only significant predictor of students’ persistence in the exp-on-mouseover group is their pretest (𝑝= 0.03, 𝛽= .04), but in a marginally significant regression model (𝑝= .08,𝑎𝑑𝑗𝑢𝑠𝑡𝑒𝑑𝑅2 = .2,𝑑𝑓= 16).
5.4 Navigation Behavior and Knowledge Growth
To understand how the work with the learning content within the system was correlated with students’ knowledge growth during the course, we used the data collected from the pretest and posttest. We attempted to correlate students’ knowledge growth with variables that describe students’ work with recommended and non-recommended problems in terms of the navigational behaviors examined above (i.e., conversion and persistence rate). We found a significant regression model (𝑝= .0001,𝑎𝑑𝑗𝑢𝑠𝑡𝑒𝑑𝑅2 = .29,𝑑𝑓= 44) where the students’ persistence on recommended problems (𝑝= .02,𝛽= 1.93) and pretest scores (𝑝= .02,𝛽= .54) can help to predict the posttest scores . These two variables, pretest and persistence on recommended problems are not correlated with each other (VIF<1.5). The impact of pretest scores on posttest is a standard result: students who start the class with stronger knowledge usually end it with stronger knowledge. However, the impact of student persistence on recommended problems on the final knowledge demonstrates that the system, as we hoped, recommended relevant problems for the students to practice. Note that other engagement-related factors were not found to be significant in the model.
5.5 Subjective Evaluation
As mentioned in section 4.2, a questionnaire was applied at the end of the study period. This instrument collected students’ opinions about the helpfulness, quality, and understandability of the explanations shown along the learning content recommendations. For this analysis, we filtered out students who selected the same option in all items to ensure the quality of the replies. After the filtering process, we analyzed the internal consistency of each scale.
5.5.1 Overall Evaluation of 𝐽𝑃3. We investigated the overall evaluation of 𝐽𝑃3 by checking students’ responses to questionnaire questions like ’Using the practice system improves my academic performance in the course’ and ’Seeing my progress in the tool motivated me to work on the available resources’ (Cronbach’s 𝛼= .85). We calculated a mean overall evaluation score from these responses. We conducted a Wilcoxon ranked sum test to check differences between no-exp and combined experiment groups (exp-on-click and exp-on-mouseover). We found a marginally significant difference (𝑈= 359, 𝑝= .09) between the no-exp group (𝑀= 3.39) and the exp group (𝑀= 3.63). Students who received textual explanations rated the system higher.
5.5.2 Recommendation quality. No significant difference was found between the no-exp(𝑀= 3.89) and combined treatment groups (𝑀= 3.7) on recommendation quality (e.g., ’I liked the learning materials recommended by the system’) (𝛼= .85), with a tendency of higher ratings by the control group.
5.5.3 Understanding Recommendations and Explanations. Finally, we explored if students understood why the system recommends certain content and the provided explanations for these recommended activities. Thus, we explored two factors in this analysis: understanding recommendations (𝛼= .80) and understanding explanations (𝛼= .74). We found no significant difference (𝑈= 526.5, 𝑝= .27) between no-exp (𝑀𝑛𝑜𝑒𝑥𝑝= 3.88) and combined experiment groups (𝑀𝑒𝑥𝑝= 3.69) in understanding why the learning activities were recommended to them (e.g., ’I understood why the activities were recommended to me.’). Next, we checked if students could understand the presented textual explanations for these recommendations. For this analysis, we compared exp-on-click and exp-on-mouseover groups. We found no significant difference (𝑡= −0.04,𝑝= .97) between expon-mouseover (𝑀𝑒𝑥𝑝𝑜𝑛𝑚𝑜𝑢𝑠𝑒𝑜𝑣𝑒𝑟= 3.36) and exp-on-click groups (𝑀𝑒𝑥𝑝𝑜𝑛𝑐𝑙𝑖𝑐𝑘=3.37) in understanding explanations. It is also critical to mention that the overall understanding level of explanations was relatively low in both conditions (𝑀= 3.37). Thus, we examined what might be the underlying reason behind the relatively low understanding of explanations. We checked if the prior knowledge of the students (i.e., pretest scores) and how much they accessed these explanations affected their evaluations. We calculated a score for explanation access by applying z-transformation to the number of clicks in exp-on-click group and the mean duration seconds of mouseovers to recommended activities in exp-onmouseover group. Then, we combined these two z-scores as a single measure (i.e., ’exp-access’). We fit a regression model with the ’understanding explanation’ factor score as the dependent variable. We used the pretest scores,
Figure 5: Interaction effect between pretest score and access to explanations on self-reported textual explanations’ understanding
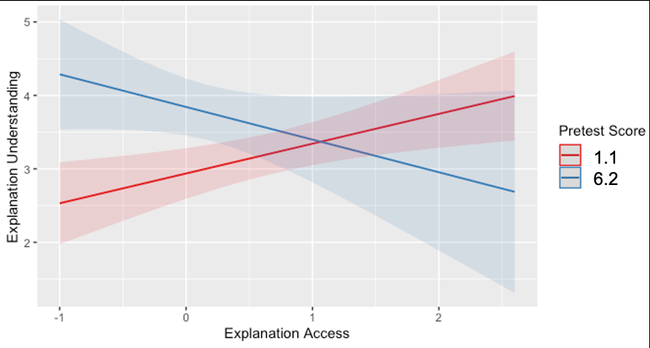
’exp-access’, and the interaction term as independent variables. We found a significant model (𝐹(3, 32), 𝑝= .008) with a significant interaction effect (𝐵= −0.42, 𝑝= .012), significant pretest scores (𝐵= 0.45, 𝑝= .002) and no significant ’exp-access’ (𝐵= −0.01, 𝑝= .90). As shown in the interaction effect plot in Fig. 5, students with lower pretest scores (red line) had higher explanation understanding with higher access to these explanations. Thus, those with low prior knowledge started to understand the explanations with more access. On the other hand, it seems like high prior knowledge students (blue line) might get confused and rate these explanations lower with more accesses.
6 DISCUSSION AND CONCLUSION
From the analysis of the students’ activity logs within 𝐽𝑃3 on a term-long classroom study, we were able to discover that the navigational support features (e.g. long mouseovers on non-recommended activities across all groups) were considerably used by the learners while using the system. These actions were found to be correlated with some students’ decisions about, for example, being more or less persistent in attempting recommended activities when students did not have access to textual explanations. We also observed that the persistence of the students on recommended problems was significantly correlated with their learning gain in the course, which shows that the recommended problems seemed to be adequately suggested based on their appropriateness for the student’s current state of learning. On the other hand, we observed that the sole addition of textual explanations to describe why a certain learning activity was suggested to the student (either accessed by clicking or on mousing over) seemed to have a positive impact on the student’s engagement with the content (challenge problems, specifically) and their willingness to explore the recommended content (through activity openings). We collected evidence that these explanations were, in fact, considerably accessed by the students multiple times. Furthermore, the multivariate regression we performed on the relationship between students’ navigational behavior and students’ engagement with the learning content, let us find out that, overall, students who did not have access to textual explanations on the
mouseover of recommended activities tend to heavily rely on their pre-existent level of knowledge (pretest) to build their confidence on working with the learning content (i.e., conversion and persistence rates). This means that for students with lower pretest levels, it is hard to make them work on the programming problems in general. However, by providing textual explanations on mouseover we discovered that the predicted values for conversion and persistence on recommended problems do not depend on the pretest score and only depend on the overall navigational behavior and access to explanations. Providing understandable explanations on educational recommendations can fill the gap that exists in lowpretest students by making them understand a bit more what are they getting recommended and how that relates to their current state or learning. In conclusion, the data collected from this study suggest that encouraging the persistence of students on appropriate recommended learning content by providing meaningful and understandable textual recommendations’ explanations on top of adequate navigational support features is possible, and it could be a very important factor in improving students learning within an online learning environment.
7 LIMITATIONS AND FUTURE WORK
The low number of students considered for the analysis ( 20 students or less per group) limits the power of our findings. We could see that when combining groups no-exp and exp-on-click into one, noexp-on-mouseover (both groups’ students did not have access to textual explanations on mouseovers) when analyzing the relations between behavioral patterns within the educational system and their work on the learning activities increased the significance of the obtained regression models. Also, considering that time and frequency of long mouseovers is a signal of student attention to recommendations is a bold assumption. Using eye-tracking to get a better picture of how students inspect these different explanatory features instead of using mean duration as a proxy of their real attention would be required for future studies.
REFERENCES
[1] Solmaz Abdi, Hassan Khosravi, Shazia Sadiq, and Dragan Gasevic. 2020. Complementing Educational Recommender Systems with Open Learner Models. In Proceedings of the Tenth International Conference on Learning Analytics amp; Knowledge (Frankfurt, Germany) (LAK ’20). Association for Computing Machinery, New York, NY, USA, 360–365. https://doi.org/10.1145/3375462.3375520 [2] Jordan Barria-Pineda, Kamil Akhuseyinoglu, Stefan Želem-Ćelap, Peter Brusilovsky, Aleksandra Klasnja Milicevic, and Mirjana Ivanovic. 2021. Explainable Recommendations in a Personalized Programming Practice System. In Artificial Intelligence in Education, Ido Roll, Danielle McNamara, Sergey Sosnovsky, Rose Luckin, and Vania Dimitrova (Eds.). Springer International Publishing, Cham, 64–76. [3] Peter Brusilovsky. 2007. Adaptive navigation support. Lecture Notes in Computer Science, Vol. 4321. Springer-Verlag, Berlin Heidelberg New York, 263–290. https: //doi.org/10.1007/978-3-540-72079-98 [4] Peter Brusilovsky, Stephen Edwards, Amruth Kumar, Lauri Malmi, Luciana Benotti, Duane Buck, Petri Ihantola, Rikki Prince, Teemu Sirkiä, Sergey Sosnovsky, Jaime Urquiza, Arto Vihavainen, and Michael Wollowski. 2014. Increasing Adoption of Smart Learning Content for Computer Science Education. In Proceedings of the Working Group Reports of the 2014 on Innovation & Technology in Computer Science Education Conference (Uppsala, Sweden) (ITiCSE-WGR ’14). ACM, New York, NY, USA, 31–57. https://doi.org/10.1145/2713609.2713611 [5] Peter Brusilovsky, Lauri Malmi, Roya Hosseini, Julio Guerra, Teemu Sirkiä, and Kerttu Pollari-Malmi. 2018. An integrated practice system for learning programming in Python: design and evaluation. Research and Practice in Technology Enhanced Learning 13, 18 (2018), 18.1–18.40. https://doi.org/10.1186/s41039-018- 0085-9 [6] Peter Brusilovsky and Sergey Sosnovsky. 2005. Individualized Exercises for Self- Assessment of Programming Knowledge: An Evaluation of QuizPACK. ACM Journal on Educational Resources in Computing 5, 3 (2005), Article No. 6. https: //doi.org/10.1145/1163405.1163411 [7] Peter Brusilovsky, Sergey Sosnovsky, and Michael Yudelson. 2009. Addictive links: The motivational value of adaptive link annotation. New Review of Hypermedia and Multimedia 15, 1 (2009), 97–118. http://dx.doi.org/10.1080/ 13614560902803570 [8] Cristina Conati, Abigail Gertner, and Kurt Vanlehn. 2002. Using Bayesian Networks to Manage Uncertainty in Student Modeling. User Modeling and User-Adapted Interaction 12, 4 (2002), 371–417. citeulike-article-id:2877137http: //dx.doi.org/10.1023/A:1021258506583 [9] Albert T. Corbett and John R. Anderson. 1995. Knowledge tracing: Modelling the acquisition of procedural knowledge. User Modeling and User-Adapted Interaction 4, 4 (1995), 253–278. [10] Hendrik Drachsler, Katrien Verbert, Olga Santos, and Nikos Manouselis. 2015. Panorama of Recommender Systems to Support Learning. Springer, Boston, MA, 421–451. https://link.springer.com/chapter/10.1007/978-1-4899-7637-612 [11] Barbara Ericson, Mark Guzdial, Briana Morrison, Miranda Parker, Matthew Moldavan, and Lekha Surasani. 2015. An eBook for Teachers Learning CS Principles. ACM Inroads 6, 4 (2015), 84–86. https://doi.org/10.1145/2829976 [12] Adam M. Gaweda and Collin F. Lynch. 2021. Student Practice Sessions Modeled as ICAP Activity Silos. In 14th International Conference on Educational Data Mining. [13] Nicola Henze and Wolfgang Nejdl. 2001. Adaptation in open corpus hypermedia. International Journal of Artificial Intelligence in Education 12, 4 (2001), 325–350. http://cbl.leeds.ac.uk/ijaied/abstracts/Vol12/henze.html [14] Roya Hosseini. 2018. Program Construction Examples in Computer Science Education: From Static Text to Adaptive and Engaging Learning Technology. Doctoral Dissertation. [15] Roya Hosseini, Kamil Akhuseyinoglu, Peter Brusilovsky, Lauri Malmi, Kerttu Pollari-Malmi, Christian Schunn, and Teemu Sirkiä. 2020. Improving Engagement in Program Construction Examples for Learning Python Programming. International Journal of Artificial Intelligence in Education 30, 2 (2020), 299–336. https://doi.org/10.1007/s40593-020-00197-0 [16] Roya Hosseini, Kamil Akhuseyinoglu, Andrew Petersen, Christian D. Schunn, and Peter Brusilovsky. 2018. PCEX: Interactive Program Construction Examples for Learning Programming. In Proceedings of the 18th Koli Calling International Conference on Computing Education Research (Koli, Finland) (Koli Calling ’18). Association for Computing Machinery, New York, NY, USA, Article 5, 9 pages. https://doi.org/10.1145/3279720.3279726 [17] Petri Ihantola, Tuukka Ahoniemi, Ville Karavirta, and Otto Seppälä. 2010. Review of recent systems for automatic assessment of programming assignments. In Koli Calling ’10: Proceedings of the 10th Koli Calling International Conference on Computing Education Research. ACM, 86–93. https://doi.org/10.1145/1930464. 1930480 [18] Sheena S. Iyengar and Mark R. Lepper. 2000. When choice is demotivating: Can one desire too much of a good thing? Journal of Personality and Social Psychology 79, 6 (2000), 995–1006. http://www.columbia.edu/~ss957/whenchoice.html [19] Alenka Kavcic. 2004. Fuzzy User Modeling for Adaptation in Educational Hypermedia. IEEE Transactions on Systems, Man, and Cybernetics 34, 4 (2004), 439–449.
[20] Hassan Khosravi, Simon Buckingham Shum, Guanliang Chen, Cristina Conati, Yi-Shan Tsai, Judy Kay, Simon Knight, Roberto Martinez-Maldonado, Shazia Sadiq, and Dragan Gašević. 2022. Explainable Artificial Intelligence in education. Computers and Education: Artificial Intelligence 3 (2022), 100074. https://doi.org/ 10.1016/j.caeai.2022.100074 [21] Andrej Krištofič and Mária Bieliková. 2005. Improving Adaptation in Web-Based Educational Hypermedia by means of Knowledge Discovery. In Proceedings of the 16th ACM Conference on Hypertext and Hypermedia. 184–192. http://doi.acm. org/10.1145/1083356.1083392 [22] Mikko-Jussi Laakso, Erkki Kaila, and Teemu Rajala. 2018. ViLLE–collaborative education tool: Designing and utilizing an exercise-based learning environment. Education and Information Technologies 23, 4 (2018), 1655–1676. https://link. springer.com/article/10.1007/s10639-017-9659-1 [23] Pablo Messina, Vicente Dominguez, Denis Parra, Christoph Trattner, and Alvaro Soto. 2019. Content-based artwork recommendation: integrating painting metadata with neural and manually-engineered visual features. User Modeling and User-Adapted Interaction 29, 2 (2019), 251–290. [24] Martijn Millecamp, Nyi Nyi Htun, Cristina Conati, and Katrien Verbert. 2019. To Explain or Not to Explain: The Effects of Personal Characteristics When Explaining Music Recommendations. In Proceedings of the 24th International Conference on Intelligent User Interfaces (Marina del Ray, California) (IUI ’19). Association for Computing Machinery, New York, NY, USA, 397–407. https: //doi.org/10.1145/3301275.3302313 [25] Jeroen Ooge, Leen Dereu, and Katrien Verbert. 2023. Steering Recommendations and Visualising Its Impact: Effects on Adolescents’ Trust in E-Learning Platforms. In Proceedings of the 28th International Conference on Intelligent User Interfaces (Sydney, NSW, Australia) (IUI ’23). Association for Computing Machinery, New York, NY, USA, 156–170. https://doi.org/10.1145/3581641.3584046 [26] Kyparisia A. Papanikolaou, Maria Grigoriadou, Harry Kornilakis, and George D. Magoulas. 2003. Personalising the interaction in a Web-based Educational Hypermedia System: the case of INSPIRE. User Modeling and User Adapted Interaction 13, 3 (2003), 213–267. [27] Dale Parsons and Patricia Haden. 2006. Parson’s Programming Puzzles: A Fun and Effective Learning Tool for First Programming Courses. In Proc. of the 8th Australasian Conf. on Computing Education - Volume 52 (Hobart, Australia) (ACE ’06). Australian Computer Society, Inc., AUS, 157–163. [28] Pearl Pu, Li Chen, and Rong Hu. 2011. A User-Centric Evaluation Framework for Recommender Systems. In Proceedings of the Fifth ACM Conference on Recommender Systems (Chicago, Illinois, USA) (RecSys ’11). Association for Computing Machinery, New York, NY, USA, 157–164. https://doi.org/10.1145/2043932. 2043962 [29] Clifford Shaffer. 2016. OpenDSA: An Interactive eTextbook for Computer Science Courses. In Proceedings of the 47th ACM Technical Symposium on Computing Science Education. ACM, 5–5. https://doi.org/citeulike-article-id:14134728doi: 10.1145/2839509.2850505 [30] Remi Sharrock, Ella Hamonic, Mathias Hiron, and Sebastien Carlier. 2017. CODE- CAST: An Innovative Technology to Facilitate Teaching and Learning Computer Programming in a C Language Online Course. In Proceedings of the Fourth (2017) ACM Conference on Learningat Scale. ACM, 147–148. https: //doi.org/10.1145/3051457.3053970 [31] Juha Sorva, Ville Karavirta, and Lauri Malmi. 2013. A Review of Generic Program Visualization Systems for Introductory Programming Education. ACM Transactions on Computing Education 13, 4 (2013). https://doi.org/10.1145/2490822 [32] Nava Tintarev and Judith Masthoff. 2015. Explaining Recommendations: Design and Evaluation. Springer US, Boston, MA, 353–382. https://doi.org/10.1007/978- 1-4899-7637-610
Do you like what you are reading? Subscribe to receive updates.
Unsubscribe anytime