
Source attribution: Publisher HTML for DOI: 10.1145/3648188.3678214, cross-checked against the supplied ACM PDF.
A New View: A hypertext view without boxes and arrows
Mark Bernstein, Eastgate Systems, Inc., United States, bernstein@eastgate.com
DOI: https://doi.org/10.1145/3648188.3678214 HT '24: 35th ACM Conference on Hypertext and Social Media, Poznan, Poland, September 2024
Hypertext visualizations embed interesting assumptions about the underlying structure of ideas. Few novel approaches to hypertext maps have been presented in recent years. The Gaudí view tessellates the idea plane, exploring an approach to presenting a greater number of notes on the screen, at the cost of restricting the fixity of the visualization: you can move notes, but notes can move themselves.
CCS Concepts: • Human-centered computing → Visualization theory, concepts and paradigms;
Keywords: Hypertext; User Interface; Voronoi Diagram
ACM Reference Format: Mark Bernstein. 2024. A New View. In 35th ACM Conference on Hypertext and Social Media (HT '24), September 10--13, 2024, Poznan, Poland. ACM, New York, NY, USA 5 Pages. https://doi.org/10.1145/3648188.3678214
1 HYPERTEXT VIEWS
People have drawn diagrams of abstract concepts for millennia, perhaps for 70,000 years [15]. Abstractions are hard to pin down: we might want to express that the force is with us, that justice and peace walk together, that the six goats I have have something in common with the six bushels of grain that you have [44]. Diagrams help.
Schematic representations of hypertext networks have always been interesting. The first review article on hypertext systems suggested that map views might be their defining characteristic [12]. Though the early history of the Web was replete with graphic schemes for representing ways to navigate around a web site [14, 24], these effort lost momentum as it became clear that navigation was not the problem it had been thought to be [3, 26] and that information-architectural signage could get people where they wanted to go [43].
More recently, a number of web-based hypertext systems that call themselves “Tools for Thought” have appeared, many of them featuring hypertext maps on an “infinite canvas” or “indefinite idea plane” [6]. Most of these visualizations can be seen as extensions of the visual ideas of NoteCards [32], Intermedia [50], Storyspace [8], and their contemporaries. It's been a while since we've seen new hypertext views.
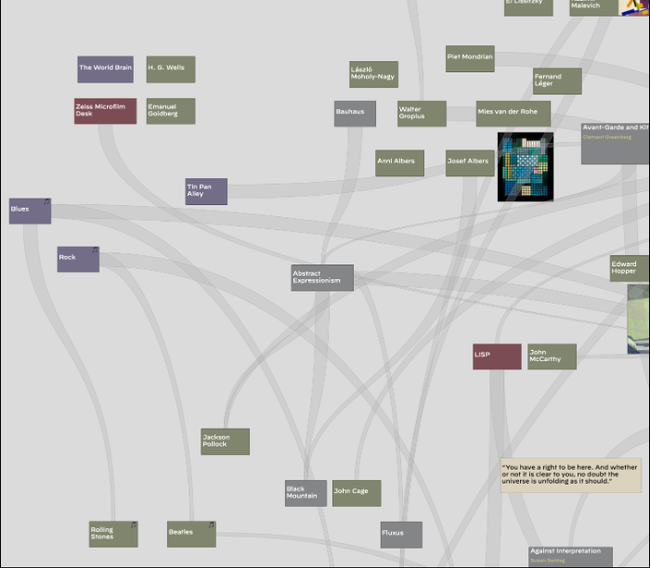
A screengrab of the Tinderbox application's Map view, showing an authors work-in-progress associating notes.
Figure 1: Part of a conventional hypertext map view, from the author's notes toward this work.
2 ORDER AND INTERTWINGULARITY
The hypertext impulse stems from two contrasting intuitions about the nature of knowledge and of writing. Much hypertext research anticipates that knowledge, when appropriately represented, expresses structural relationships among concepts and that these relationships capture an underlying structure inherent to the domain. This often adopts an explicitly structuralist frame, most notably in ZigZag [40] where each structural binary can be encoded and represented as a spatial dimension. The grand ontological experiments of the semantic Web extend this line of work, as do the formalist efforts in early hypertext research [13, 27, 34]. A second, conflicting intuition holds that “everything is intertwingled” [39], maintaining that the true network of connections among concepts is deeply tangled and that the best that we can hope is that our hypertexts capture some partial shadow of those connections, one which we can grasp by excluding (perhaps temporarily) other connections from our immediate consideration. Spatial hypertext embraces this view [5, 33].
These questions, typical of classical hypertext research, perfuse contemporary thought. Recent years have seen a number of monographs about organizing principles, many of them diagrammatic, for collections of knowledge. These include the footnote [20], alphabetical order [17], timelines [43], trees [28], literary maps [38], and such paratexts as dedications, epigraphs, and stage directions [22]. Others have studied knowledge maps [10, 47] and the epistemological foundations and consequences of the organization of early libraries [11, 49]. Recent years have also seen great interest in studies of the development of text itself [41, 44], of literature [37], of the history of visualization [42], the recovery of meaning from lost scripts [9], and the relationships between texts and such writing spaces as bound notebooks [1, 16, 21].
All these studies can inform our hypertext visualizations. Yet we have no really adequate survey of hypertext views at all, and certainly not for the efflorescence of hypertext visualizations in such systems as Obsidian, Roam, Notion, Tana, Twine, The Brain, LogSeq, and others. These systems exert notable impact on practice, although their creators have not always contributed to the research literature or discussed the intellectual foundations of their design choices.
3 MAPS
Figure 1 shows a contemporary hypertext map [4]. Each note is represented by a rectangle (or other shape), which has a title. Notes may also have a subtitle, a caption, and may contain an indefinite amount of styled text and images. Notes may contain other notes as well, and may be nested to whatever depth is useful. Links connect notes, or in some systems links connect text spans or other note components to components of other notes [48]. The entire view may be panned and zoomed, and individual notes may be repositioned or resized as desired.
Similar diagrams have been used for a long time, and one testament to their utility is that a journal of information architecture was named “Boxes and Arrows.” Some shortcomings of these maps are also well known: they tend not to be very dense, relationships among links can be difficult to see, and link clarity is often at odds both with fluent linking and with compactness. Quite a lot of Figure 1 is empty space, and while white space can be eloquent in the visual arts, the white space in hypertext maps does not always have much to say.
It is not difficult to see in the familiar hypertext map an echo of modern architectural sensibility. Rectilinear forms echo the pixel grid, and in the era of low-resolution displays helped avoid aliasing artifacts. This makes their representation look good and simplifies computation: form ever follows function [45]. A note about Bauhaus founder Walter Gropius shares visual properties and UI affordances with a note about LISP founder John McCarthy, echoing the late modernist fascination with syntax and semantics [7]. Might other approaches to organizing space fit better with our own (diverse) contemporary approaches and interests?
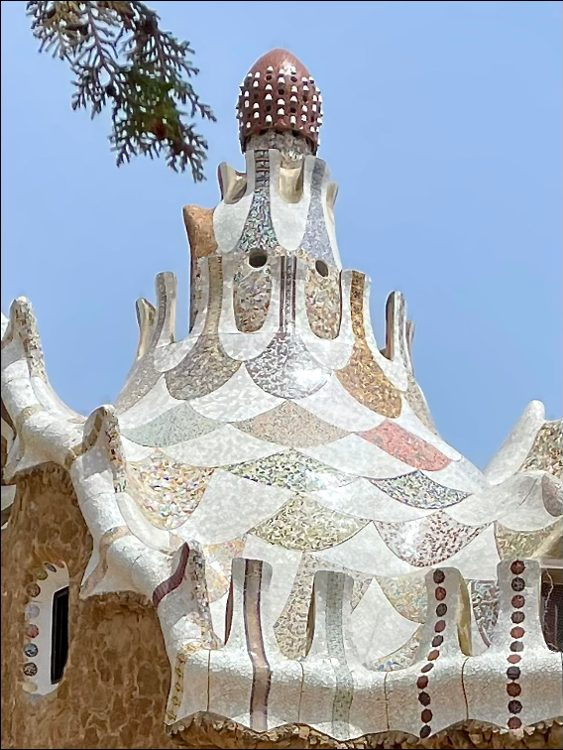
A photo of a curved roof displaying Gaudí’s distinctive trencadís finish from small pieces of glazed tile. The roof is on the gatehouse to the Park Güell in Barcelona, Spain, from 1904.
Figure 2: Trencadís tilework from Antoní Gaudí, Park Güell, Barcelona, 1904. Photo by the author.
4 GAUDí VIEW
We might find an alternative approach to the hypertext map in the architecture of Antoni Gaudí, a Catalan architect best known for his organic hyperboloid curvilinear surfaces covered in trencadís — mosaics composed from fragments of broken ceramic tiles. This colorful medium uses inexpensive waste materials and adapts easily to the curvature of its underlying substrate.
Let us consider how trencadís tilework might apply to a hypertext view. We have, as in Figure 1, some notes which are placed in the plane. However they are arranged, we may reasonably ask a variety of questions about their geometry. Which notes are neighbors? Might it be useful to arrange notes so that related notes are near each other? How can we express relationships among notes without reducing the screen to a meaningless cacophony? (And, indeed, is cacophony always such a bad thing to express in a universe that has struck many, from Kohelet and Job, as inherently chaotic? Is meaning not elusive and perhaps illusory? [6])
There is never enough screen space. The human eye can only grasp roughly 7-14 megapixels of information at a glance; we can get some more information by moving our eyes or by panning and zooming the display, but this limitation matters. If we set out to organize our research results by spreading index cards across a picnic table [36], we might wish for a bigger table or smaller cards, but we also sense that true physical limits are approaching: if our picnic table were the size of an athletic field, it might not be enough. Awaiting better screens is no longer a viable strategy, so efficient use of the visual field must be a priority.
One of the chief virtues of map views (and a central idea of spatial hypertext) is the interplay between a note and its neighbors. But what do we mean by “a note's neighbors”? Perhaps we mean “linked” notes, but links may be of different types [29] and not all links are equally interesting. We might list all the notes within a fixed distance of some point. Another approach might list all the notes that are adjacent to a note in which we are interested. But what do we mean by “adjacent”? In Figure 3, for example, are notes “Bill Seitz Spreadsheet” and “Digital Gardens Repository adjacent, or not?
One way to resolve these quandaries may be the Voronoi diagram [19]. For a configuration of notes placed at points P1, P2...Pn in the Cartesian plane, we associate with each note the open set of points that are closer to that note than to any other note. These boundaries determine the shape of each note. Though a naïve implementation of Voronoi diagrams is O(n2 log n), Fortune's algorithm [18] derives the Voronoi diagram in O(n log n) time.
Given the Voronoi diagram of the hypertext map, we can derive a convex polygon that surrounds each note. The edges of this polygon are the perpendicular bisectors of the rays drawn from our note to its neighbors. We define the shape or “hull’ of the note by insetting this convex polygon slightly to allow the notes some “grout space”, and round the corners with Bezier splines for better aesthetics. The grout space can then be used to show links among notes. Notes that share a Voronoi edge are neighbors; those that do not, are not.
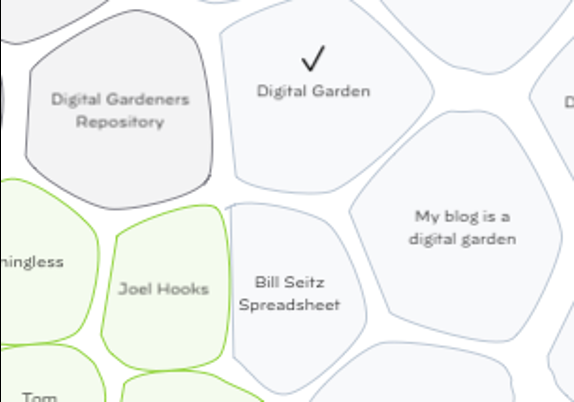
An example of the new Gaudí view showing contingent notes of different shape and colour.
Figure 3: What might the adjacency of notes imply?
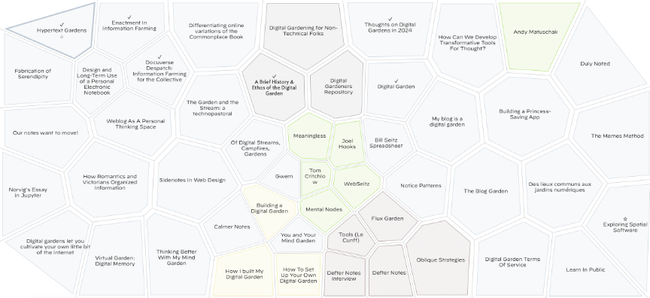
An example of the new Gaudí view showing the aggregation of different groups of notes.
Figure 4: A Gaudí view containing roughly 50 notes about Information Gardening.
At this point, some notes might be much larger than others, based only on their position. Lloyd's Relaxation [30] provides a convenient way to reallocate space. In essence, we move each note toward the center-of-gravity or centroid of its domain, and then recompute the Voronoi diagram for the new locations. Iteration continues until changes in the diagram become small. Because small changes in site placement evoke only small changes in the Voronoi diagram, this relaxation preserves much of the sense of the diagram even though notes move without our explicit permission. In this way, each note's position moves toward the center of its hull, and the area of each note tends toward rough equality.
5 COMPACTNESS, CONTINGENCY, CHANCE
Using this procedure, our map gradually tends towards a hexagonal tiling of the plane. Because hexagonal tiling is optimal, this fits lots of notes into the viewport. As in treemaps [2, 28], most pixels are working in the service of notes. Yet by stopping the integration a little early, we retain some variety in shape and placement. This variability makes it easier to read the diagram and to relocate notes of interest.
The user is free to add or move notes as she desires. In response, other notes in the diagram also move. For example, if we create a note, nearby notes move and shrink to give the new note a fair share of the available screen. As we move a note, its shape changes to reflect the location of its new neighbors.
Because notes often have 5–7 neighbors, some of those neighbors may be inadvertent. Occasionally, such accidental encounters may inspire new connections. In making research notes, for example, it can be helpful to see not only the relationships you anticipate, but also to speculate on relationships between your current focus and other notes in your project. The Web gives us unprecedented ability to search for a wealth of resources we want to review, but I sometimes miss the library stacks in which you might find almost anything while trying to track down some elusive volume.
6 STABILITY AND FORCE
Hypertext research has usually assumed that, when you put a note somewhere, it ought to stay where you put it [25]. In consequence, hypertext maps tend to be stable: they change incrementally as notes are added, moved, or deleted, but the map today will generally resemble the map tomorrow1. This stability is desirable and useful, both in terms of finding what once we wrote, and also in expressing the sense that hypertext writing is architectonic [7] — that our hypertext notes are tangible, permanent entities on which we can rely, not fleeting and vaporous phantasms. Many systems have been reluctant to disrupt this stability: for example, spatial parsers typically request the user's permission before repositioning misaligned elements [35, 44].
Gaudí view is not stable: notes change shape as they move, and other notes move and change shape to adapt to the space those notes have vacated. This instability is not an insuperable inconvenience because, though things change shape and move, the changes are typically gradual and local. If you are working on several notes about Alan Turing that you've dragged to the top of the view, they will tend to remain near the top of the view. Thus, the informal semantic power of spatial hypertext remains, although we lose the Palladian intricacies of patterns that depend on symmetry [5].
To extend this contingent quasi-stability, we use a force predicate that adds a small attractive force between pairs for which the predicate is satisfied. If the force predicate is
$Tags(this).intersects($Tags(that))
then notes that share at least one tag will tend to gather together. Similarly, each edge of the viewport has its own force predicate; if the right edge has the force expression $Sentiment>0.6, then enthusiastic notes will tend to drift toward the right. These forces join with a friction force and with each note's attraction to the centroid of the hull. A simple verlet integration [23] is then followed by recalculating the Voronoi diagram and updating the display; good frame rates were obtained with 200 notes on pedestrian hardware, and this approaches the limit of titled notes on a 27′′ display. (The conventional map view excerpted in Figure 1 fits roughly 80 notes into the same area.)
The relationship between note as icon and note as representation deserves greater exploration. As Mark Anderson has pointed out, some hypertext users are content that the visual representation of a note be symbolic, an icon that stands for the note without being the note itself, just as a Byzantine mosaic might invite contemplation of a saint without attempting to depict that specific saint's actual appearance. Other hypertext users —and others systems — prefer that the representation be the note itself, albeit perhaps seen at a distance from which not all details are legible. If the note is an icon, a user might select or “open” it to learn what is inside; if the note is itself, a user might approach the element more closely in order to see more detail. These considerations resonate in interesting ways with recent epistemological thought about “thinking with things” [31], reviving Engelbart's mission to build intellectual prostheses.
Many aspects of the view remain to be explored. The Gaudí view should welcome fisheye views and hyperbolic geometries; indeed, hyperbolic architectural surfaces motivated Gaudí’s embrace of trencadís tilework. If adjacent notes are linked, we might merge their hulls to form a larger composite object. Edge forces were intended to impose semantics on the plane, but might also be used to differentiate notes based on continuous variables, by analogy to chromatography or electrophoresis. Moreover, the seemingly simple matter of typesetting inside a convex irregular polygon is surprisingly tricky, and the aesthetic problems of expressing the individuality of notes (by title, by icon, by color, or otherwise) without cacophonous visual clutter is intriguing.
ACKNOWLEDGMENTS
For stimulating and useful discussions, I would like to thank Mark W. R. Anderson, David A. Bayer, Serina Hu, the late George P. Landow who is sorely missed, Everardo Reyes, and Ben Shneiderman.
REFERENCES
Roland Allen. 2023. The Notebook: A History of Thinking on Paper. Profile Books, London, UK. 342 pages. https://profilebooks.com/work/the-notebook/
Benjamin B. Bederson, Ben Shneiderman, and Martin Wattenberg. 2002. Ordered and quantum treemaps: Making effective use of 2D space to display hierarchies. ACM Trans. Graph. 21, 4 (2002), 833–854. https://doi.org/10.1145/571647.571649
Mark Bernstein. 1991. The Navigation Problem Reconsidered. In Hypertext/Hypermedia Handbook, Emily Berk and Joseph Devlin (Eds.). McGraw-Hill Inc.,US, New York, NY, USA, 285–297.
Mark Bernstein. 2003. Collage, Composites, Construction. In Proceedings of the Fourteenth ACM Conference on Hypertext and Hypermedia (Nottingham, UK) (HYPERTEXT ’03). Association for Computing Machinery, New York, NY, USA, 122–123. https://doi.org/10.1145/900051.900077
Mark Bernstein. 2011. Can We Talk about Spatial Hypertext?. In Proceedings of the 22nd ACM Conference on Hypertext and Hypermedia (Eindhoven, Netherlands) (HT ’11). Association for Computing Machinery, New York, NY, USA, 103–112. https://doi.org/10.1145/1995966.1995983
Mark Bernstein. 2023. The Indefinite Idea Plane Artistically Considered. International Journal of Design Sciences & Technology 25, 2 (2023).
Jay David Bolter. 1991. Writing Space: The Computer, Hypertext and the History of Writing. Vol. 1st ed.Lawreance Earlbaum Associates, Hillsdale, NJ, USA. 246 pages.
Jay David Bolter and Michael Joyce. 1987. Hypertext and Creative Writing. In Proceedings of the ACM Conference on Hypertext (Chapel Hill, North Carolina, USA) (HYPERTEXT ’87). Association for Computing Machinery, New York, NY, USA, 41–50. https://doi.org/10.1145/317426.317431
Jed Z. Buchwald and Diane Greco Josefowicz. 2022. The Riddle of the Rosetta: How an English Polymath and a French Polyglot Discovered the Meaning of Egyptian Hieroglyphs. Princeton University Press, Princeton, NJ, USA. 576 pages.
Katy Börner. 2015. Atlas of Knowledge: Anyone Can Map. MIT Press, Cambridge, MA, USA. 224 pages.
Lionel Casson. 2001. Libraries in the Ancient World. Yale University Press, New Haven, CN, USA. 191 pages.
Jeff Conklin. 1987. Hypertext: An Introduction and Survey. IEEE Computer 20, 9 (1987), 17–41. https://doi.org/10.1109/MC.1987.1663693
Jeff Conklin and Michael L. Begeman. 1988. gIBIS: A Hypertext Tool for Exploratory Policy Discussion. ACM Transactions on Information Systems (TOIS) 6, 4 (1988), 303–331. https://doi.org/10.1145/58566.59297
Andreas Dieberger. 1996. Browsing the WWW by Interacting with a Textual Virtual Environment—a Framework for Experimenting with Navigational Metaphors. In Proceedings of the Seventh ACM Conference on Hypertext: Docuverse Takes Form (Bethesda, Maryland, USA) (HYPERTEXT ’96). Association for Computing Machinery, New York, NY, USA, 170–179. https://doi.org/10.1145/234828.234845
Matthew Daniel Eddy. 2021. Diagram. In Information: A Historical Companion, Media Mind and the (Eds.). Princeton University Press, Princeton, NJ, USA.
Matthew Daniel Eddy. 2022. Media and the Mind: Art, Science, and Notebooks as Paper Machines, 1700-1830. University of Chicago Press, Chicago, IL, USA. 531 pages.
Judith Flanders. 2020. A Place For Everything. Pan Macmillan, London, UK. 272 pages.
S Fortune. 1986. A sweepline algorithm for Voronoi diagrams. In Proceedings of the Second Annual Symposium on Computational Geometry (Yorktown Heights, New York, USA) (SCG ’86). Association for Computing Machinery, New York, NY, USA, 313–322. https://doi.org/10.1145/10515.10549
Jean Gallier. 2007. Notes on Convex Sets, Polytopes, Polyhedra Combinatorial Topology, Voronoi Diagrams and Delaunay Triangulations. Technical Report. INRIA. https://inria.hal.science/inria-00193831/PDF/convex-RR.pdf
Anthony Grafton. 1999. The Footnote - A Curious History. Harvard University Press, Camridge, MA, USA. 255 pages.
Jillian M. Hess. 2022. How Romantics and Victorians Organized Information: Commonplace Books, Scrapbooks, and Albums. Oxford University Press, Oxford, UK. 320 pages. https://doi.org/10.1093/oso/9780192895318.001.0001
Kevin Jackson. 2000. Invisible Forms: A Guide to Literary Curiosities. St Martin's Press, New York, NY, USA. 310 pages.
T. Jakobsen. 2001. Advanced character physics. In Proceedings Game Developer's Conference, 2001 (Chapel Hill, North Carolina, USA). CMP Media LLC, San Jose, CA, USA. https://web.archive.org/web/20020802023218 http://www.gdconf.com/archives/proceedings/2001/prog_papers.html
Paul Kahn and Krzysztof Lenk. 2001. Mapping Web Sites. Rotovision SA, Hove, UK. 144 pages.
Nancy Kaplan and Stuart Moulthrop. 1994. Where No Mind Has Gone Before: Ontological Design for Virtual Spaces. In Proceedings of the 1994 ACM European Conference on Hypermedia Technology (Edinburgh, Scotland, UK) (ECHT94). Association for Computing Machinery, New York, NY, USA, 206–216. https://doi.org/10.1145/192757.192832
George P. Landow and Paul Kahn. 1992. Where's the Hypertext: The Dickens Web As a System-independent Hypertext. In Proceedings of the ACM Conference on Hypertext (Milan, Italy) (ECHT ’92). Association for Computing Machinery, New York, NY, USA, 149–160. https://doi.org/10.1145/168466.168515
Douglas B. Lenat, Alan Borning, David W. McDonald, Craig Taylor, and Steven Weyer. 1983. Knoesphere: Building Expert Systems With Encyclopedic Knowledge. In 8 (Karlsruhe, DE). William Kaufmann, San Francisco, CA, USA, 167–169.
Manuel Lima. 2014. The Book of Trees. Princeton Architectural Press, New York, NY, USA. 192 pages.
Lippincott's Magazine 1896. The Tall Office Building Artistically Considered. Lippincott's Magazine 57 (1896), 403–409 pages.
S. Lloyd. 1982. Least squares quantization in PCM. IEEE Transactions on Information Theory 28, 2 (1982), 129–137. https://doi.org/10.1109/TIT.1982.1056489
Larissa MacFarquhar. 2018. The Mind-Expanding Ideas of Andy Clark. New Yorker Magazine, New York, NY, USA. Retrieved May 4, 2024 from https://www.newyorker.com/magazine/2018/04/02/the-mind-expanding-ideas-of-andy-clark
Catherine C Marshall. 1986. NoteCards™ Release 1.2 Reference Manual. Technical Report. Xerox Corporation. https://interlisp.org/documentation/notecards_user_guide_v1.2.pdf
Catherine C. Marshall. 2001. NoteCards in the Age of the Web: Practice Meets Perfect. ACM Journal of Computer Documentation (JCD) 25, 3 (2001), 96–103. https://doi.org/10.1145/507317.507325
Catherine C. Marshall, Frank G. Halasz, Russell A. Rogers, and William C. Janssen, Jr.1991. Aquanet: A Hypertext Tool to Hold Your Knowledge in Place. In Proceedings of the Third Annual ACM Conference on Hypertext (San Antonio, Texas, USA) (HYPERTEXT ’91). Association for Computing Machinery, New York, NY, USA, 261–275. https://doi.org/10.1145/122974.123000
Catherine C. Marshall and Frank M. Shipman, III. 1995. Spatial Hypertext: Designing for Change. Communications of the ACM (CACM) 38, 8 (1995), 88–97. https://doi.org/10.1145/208344.208350
John McPhee. 2017. Draft No. 4: On the Writing Process. Farrar, Straus and Giroux, New York, NY, USA. 208 pages.
John W. Miller. 2004. How the Bible Came to Be : Exploring the Narrative and Message. Paulist Press, Mahwah, NJ, USA. 208 pages.
Franco Moretti. 2007. Graphs, Maps, Trees: Abstract Models for a Literary History. Verso, London, UK. 124 pages.
Theodor Holm Nelson. 1974. Computer Lib/Dream Machines. Vol. 1978 Reprint of 1974 Edition. Self-published, n/a. 336 pages.
Theodor Holm Nelson. 2001. Some Alternative Computer Universes. In Creative Digital Media: Its Impact on the New Century. Keio University COE International Symposium. Keio University Press,, Tokyo, Japan, 33–38.
Amanda Podany. 2022. Weavers, Scribes, and Kings : A New History of the Ancient Near East. Oxford University Press, Oxford, UK. 672 pages. https://global.oup.com/academic/product/weavers-scribes-and-kings-9780190059040
Sandra Rendgen. 2019. History of Information Graphics. Taschen, Köln, DE. 462 pages.
Daniel Rosenberg and Anthony Grafton. 2010. Cartographies of Time. Princeton Architectural Press, New York, NY, USA. 272 pages.
Thomas Schedel and Claus Atzenbeck. 2016. Spatio-Temporal Parsing in Spatial Hypermedia. In Proceedings of the 27th ACM Conference on Hypertext and Hypermedia (Halifax, Nova Scotia, Canada) (HT ’16). Association for Computing Machinery, New York, NY, USA, 149–157. https://doi.org/10.1145/2914586.2914596
Denise Schmandt-Besserat. 1997. How Writing Came About. University of Texas Press, Austin, TX, USA. 207 pages.
Frank M. Shipman, III, Haowei Hsieh, Preetam Maloor, and J. Michael Moore. 2001. The Visual Knowledge Builder: A Second Generation Spatial Hypertext. In Proceedings of the 12th ACM Conference on Hypertext and Hypermedia (Århus, Denmark) (HYPERTEXT ’01). Association for Computing Machinery, New York, NY, USA, 113–122. https://doi.org/10.1145/504216.504245
Randall H. Trigg. 1983. A Network-Based Approach to Text Handling for the Online Scientific Community. Ph. D. Dissertation. University of Maryland, College Park, MD, USA.
Peter Turchi. 2004. Maps of the Imagination : The Writer as Cartographer. Trinity University Press, San Antonio, TX, USA. 246 pages.
E. James Whit Whitehead. 2002. Uniform Comparison of Data Models Using Containment Modeling. In Proceedings of the Thirteenth ACM Conference on Hypertext and Hypermedia (College Park, Maryland, USA) (HYPERTEXT ’02). Association for Computing Machinery, New York, NY, USA, 182–191. https://doi.org/10.1145/513338.513384
Nicole Yankelovich, Bernard J. Haan, Norman K. Meyrowitz, and Steven M. Drucker. 1988. Intermedia: The Concept and the Construction of a Seamless Information Environment. Computer 21, 1 (1988), 81–96. https://doi.org/10.1109/2.222120
FOOTNOTE
1Indeed, in VKB you could see yesterday's map, or last year's, and retrace their evolution into today's. [46]
Permission to make digital or hard copies of all or part of this work for personal or classroom use is granted without fee provided that copies are not made or distributed for profit or commercial advantage and that copies bear this notice and the full citation on the first page. Copyrights for components of this work owned by others than the author(s) must be honored. Abstracting with credit is permitted. To copy otherwise, or republish, to post on servers or to redistribute to lists, requires prior specific permission and/or a fee. Request permissions from permissions@acm.org.
HT '24, September 10–13, 2024, Poznan, Poland
© 2024 Copyright held by the owner/author(s). Publication rights licensed to ACM.
ACM ISBN 979-8-4007-0595-3/24/09.
Do you like what you are reading? Subscribe to receive updates.
Unsubscribe anytime