
Supporting the End-User Curation of Cultural Heritage Knowledge Graphs
Authors: Paul Mulholland , The Open University, United Kingdom, p.mulholland@open.ac.uk; Peter Van Kranenburg , Royal Netherlands Academy of Arts and Sciences, Netherlands, peter.van.kranenburg@meertens.knaw.nl; Jason Carvalho , The Open University, United Kingdom, jason.carvalho@open.ac.uk; Enrico Daga , The Open University, United Kingdom, enrico.daga@open.ac.uk; KEYWORDS: Hypertext paths , Knowledge Graphs , Cultural heritage , Curation
Published in: HT '24: 35th ACM Conference on Hypertext and Social Media, Poznan, Poland, September 10–13, 2024 DOI: 10.1145/3648188.3675132 License: CC BY 4.0
Abstract
Knowledge Graphs are becoming widely used as a method to capture and integrate diverse sources of data into a unified structure of nodes and links. Cultural heritage is an active domain for Knowledge Graph research, bringing together the metadata of cultural objects with associated information about their use and history. Tools exist for the searching and browsing of Knowledge Graphs but on their own they often do not offer the interpretative support required by a more general audience. This paper describes an approach to creating a layer of interpretation over a Knowledge Graph. Experts in the cultural domain, without expertise in the underlying technology, can curate paths through the Knowledge Graph, selecting and associating cultural objects, which are automatically displayed in the path with relevant content from the Knowledge Graph. Path authors can also provide additional interpretation as well invite responses from followers of the paths. A case study is described in the domain of European pipe organs in which domain experts can curate paths through a Knowledge Graph of currently approximately 2000 objects. The potential of the approach as a way of incrementally formalizing changes or additions to the Knowledge Graph emerged as a theme with domain experts. The applicability of the approach to cultural Knowledge Graphs in general is discussed.
1 INTRODUCTION
Knowledge Graphs are becoming a common method for integrating diverse sources of data into a unified representation comprising entities and relations between those entities [26]. Initiatives in the digital humanities have led to the development of numerous Knowledge Graphs in the cultural sector, e.g. [6,7,10,13,28,47,48], integrating, for example, a museum's collections record of artworks with additional sources of information such as artist biographies and thesauri. Knowledge Graphs, as a machine-readable representation, can be used to drive services such as recommendation, search and question answering. Knowledge Graphs can also be used by humans as an integrated source of information, particularly in domains such as cultural heritage.
Tools exist for searching Knowledge Graphs and traversing their node-link structure either in a graphical or tabular form [5,27,37,49]. In this paper we describe our work in making a cultural heritage Knowledge Graph usable by a human audience, specifically a Knowledge Graph of nearly 2000 European pipe organs, describing their constituent parts and preservation history. The structure of the Knowledge Graph can create a barrier to human navigation and use if not appropriately presented. However, this is not the only barrier. Our initial work also met the need to provide a layer of interpretation over the Knowledge Graph, not only sufficiently abstracting away from the node-link structure of the Knowledge Graph but also providing guidance through the vast volume of content and contextual support for making sense of the provided information. This need can be seen to parallel the distinction between an online museum collection and a physical or virtual exhibition. An online collection provides access to museum objects and their metadata, but an exhibition provides additional narrative support in the interpretation of objects, making associations between objects and their relationship to historical and societal contexts [18,35].
Algorithmic approaches could provide some of this interpretative support, in particular recommender systems could be used to help manage the volume of available content, suggesting items based on popularity or user interest. Alternatively, a social approach could be taken. For example, with appropriate support, experts in the heritage domain, without expertise in the technology, could curate the Knowledge Graph for the benefit of a broader audience. Building on previous Hypertext research, the concept of paths [20,43] could offer a promising curatorial mechanism, enabling the domain expert to act as a guide through content in the Knowledge Graph.
The rest of the paper is structured as follows. Section 2 outlines related work on Knowledge Graphs, the search and browsing of Knowledge Graph and cultural heritage content, social support for cultural interpretation and the use of hypertext paths and similar structures to support navigation and understanding. Section 3 describes the Knowledge Graph of pipe organs and section 4 describes lessons learned from its use by domain experts. Section 5 describes the software developed for Knowledge Graph curation and section 6 describes feedback from domain experts. Section 7 concludes with a discussion of the generality of the approach, the role it could play in formalizing new knowledge as well as wider implications and potential future research directions.
2 RELATED WORK
2.1 Knowledge Graphs
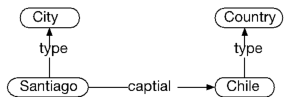
Knowledge Graphs use a graph-based data model to capture knowledge from diverse data sources at scale [26]. When using a graph-based data model, entities are represented as nodes within the graph and edges (i.e. links between nodes) are used to represent relations between those entities. Using the example from Hogan et al [26] the statement “Santiago is the capital of Chile” could be represented using a relation capital connecting the node Santiago to the node Chile. A Knowledge Graph can also be used to define the types of the entities to be represented in the Knowledge Graph, for example, that Santiago is a city and Chile is a country (figure 1). An entity type, such as City and Country, is referred to as a class. A relation between entities, such as capital, is referred to as a property. Ontologies [23] can be used to define and reason over terms used in the Knowledge Graph [16,26,33], for example, that that all capitals of a country are cities even if this is not declared explicitly in the Knowledge Graph.
A Knowledge Graph representation of the city of Santiago being the capital of the county Chile
Figure 1: A Knowledge Graph representation of the city of Santiago being the capital of the county Chile.
Knowledge Graphs are perceived to have advantages over alternative data models such as relational databases, as the schema according to which the data is organised (i.e. structure of the database tables in the case of relational databases, or the ontologies in the case Knowledge Graphs) can evolve in a more flexible manner during construction of the Knowledge Graph [26].
The graph-based data in a Knowledge Graph is typically represented using the Resource Description Framework (RDF) as a set of subject-predicate-object triples. For example, Santiago being the capital of Chile, could be represented as a single RDF triple with Santiago as the subject, capital as the property and Chile as the object. Several tools are available for mapping data to RDF from different source formats such as CSV, JSON and XML. These include R2RML [11], RML [14], YARRRML [25] and SPARQL Anything [9]. Such tools support the construction of a Knowledge Graph integrating multiple sources of data from different formats.
2.2 Knowledge Graphs and Cultural Heritage
The cultural heritage domain has proved to be a rich area for Knowledge Graph research. Illustrative examples include the Amsterdam Linked Open Dataset [13] which contains the descriptions of over 70,000 objects in the collection of the Amsterdam Museum. The dataset uses an RDF graph to interconnect the object descriptions with both a thesaurus of concepts (e.g. events, geographical locations) and an authority file of over 60,000 people who created, owned, or are depicted in, the artworks.
Szekely et al [47] describe the mapping of collection metadata from the Smithsonian American Art Museum (SAAM) database to RDF. The database included the data of over 40,000 museum objects and over 8,000 artists. The resulting RDF graph was interlinked with entities from DBpedia and the Getty Union List of Artist Names (ULAN).
Daquino et al [10] describe the process of mapping the Zeri Photo Archive catalog into RDF. This involved describing the entries in the archive according to the CIDOC CRM ontology for the description of cultural heritage data [15] as well as custom ontologies for the description of photography and artworks.
ArCo [6,7] is the Italian Cultural Heritage knowledge graph consisting of over 820,000 cultural entities. ArCo includes software for automatically mapping catalogue records into RDF. The Arco Knowledge Graph uses the ArCo ontology network of seven ontologies to describe the artworks in terms of their catalogue records, location, physical state, and associations to persons (e.g. artists, collectors) and events (e.g. exhibitions).
Warsampo [28] is a Knowledge Graph of the Second World War with a focus on Finnish military history. WarSampo used an extension of the CIDOC CRM ontology [15] to represent war as a sequence of spatiotemporal events in which soldiers, military units and other actors participate.
TRANSRAZ [48] is a Knowledge Graph of the history of Nuremberg. The goal of the Knowledge Graph is to enable the exploration of the city's architecture as a 3D model. The Knowledge Graph maps and integrates data from several sources including archive records of where people lived in Nuremberg, artist biographies, and scholarly articles on the city's history.
2.3 Knowledge Graph usability
The most ubiquitous mode of access to data in a Knowledge Graph is via SPARQL, a textual language for querying data stored as RDF. Most Knowledge Graphs provide a web based SPARQL endpoint through which the Knowledge Graph can be queried manually or programmatically.
Buil-Aranda et al [4] observe that when accessing data from a SPARQL endpoint the user is often confronted within an empty query box, offering no assistance in formulating the desired query. Their log analysis of queries to a SPARQL endpoint shows that users tend to pursue a trial-and-error process, incrementally adding and removing parts of the query until they obtain the desired result. Users have been found to have cognitive difficulties in understanding SPARQL queries, particularly those involving either negation or traversing paths of triples in the inverse direction from object to subject [50].
Several tools have been developed to support SPARQL querying. For example, YASGUI [37] provides syntax highlighting and checking to assist query formulation. YASGUI is widely used to provide access to Knowledge Graphs. RDF Explorer [49] provides a visual interface for query construction that also supports Knowledge Graph browsing. In designing the interface, their objective was to not only lower the syntactic burden of SPARQL through a visual interface but also though browsing support, address the problem of the user not necessarily understanding the content and structure of the Knowledge Graph to be queried.
Tools have also been developed with the primary aim of supporting Knowledge Graph browsing. LoDLive [5] provides a node-link visualisation of the Knowledge Graph in which the user can browse by expanding nodes and their connections. LodView [27] provides a tabular representation in which each row represents a property value pair from a selected node. MELODY [36] is a tool to enable experts to retrieve data using a SPARQL query and visualise the results for an end-user audience in different formats including charts, maps and tables.
2.4 Exploratory search and generous interfaces
The term exploratory search [29,51] is used to describe a form of information seeking where the goal is more open-ended and evolves through interaction with the search results. Exploratory search can be contrasted with simple lookup search, where the question and how to formulate it are known in advance. The LoDView interface, with its combination of search and navigation, can be thought of an example of exploratory search, in which an understanding of the data and how it can be queried develops through use of the tool.
Generous interfaces [45,52] emerged in the cultural heritage sector as an alternative to search for interacting with digital cultural archives. Using similar interaction techniques to exploratory search, generous interfaces aim to provide the user with a rich, browsable form of interaction with digital collections, in contrast to the ungenerous interaction of search interfaces, where the onus is on the user to articulate what they want rather than select from what is presented to them.
2.5 Social approaches to cultural interpretation
One design challenge for generous interfaces is deciding what to show the user as a starting point to exploring the archive or some component of it, which could potentially contain thousands of objects. Faceted search can provide a partial solution in which the user can, for example, with an archive of artworks filter on properties such as artist or year. Algorithmic methods can also be used to recommend content based on popularity or according to a profile of the user's interests. However, even if algorithmic methods can successfully filter the available content without introducing filter bubbles or narrowing the diversity of the presented content [24], this would not necessarily assist the user in making sense of the objects presented which may benefit from interpretation skills or background art or historical knowledge.
An alternative to the algorithmic approach is to take a directly social approach, in which users select and contextualize content for the benefit of others. (Some forms of algorithmic recommendation can be thought of social in an indirect way, ranking the popularity of content based on the actions of previous users.) One socially mediated approach to guiding the selection and interpretation of content is interpersonalisation. Interpersonalisation recognizes the role that people can play in personalising experiences for each other [17,38]. Interpersonalisation has been applied specifically in the design of museum technology, assisting museum visitors to share responses with other visitors, such as friends and family, to build a level of shared meaning over the cultural objects. Interpersonalisation is seen as complementary to both human customisation (in which the user configures the interface for themselves) and system personalisation (in which the software makes decisions on behalf of the user).
Another socially mediated approach applied in the cultural sector is Citizen Curation. Citizen Curation can be defined as individuals and groups from outside the museum sector actively engaging in curatorial activities to communicate ideas and stories [8,46]. Citizen Curation has been used to introduce new perspectives to the museum's public offering from communities traditionally underrepresented among museum visitors and staff [31,46]. A key difference between interpersonalisation and Citizen Curation is that interpersonalisation adapts the experience for a known other such as friend or relative, whereas Citizen Curation is undertaken as a civic contribution in a public cultural space, for use by others who may be unknown to the contributor.
2.6 Hypertext paths, trails and scripts
Within the Hypertext field and more widely, linear routes though hypertexts or documents, variously named paths, trails or scripts are an established method for lowering the navigation burden and sharing productive routes through an information space. A significant example is Walden Paths [20,43] which was developed to enable teachers to create directed paths across pages on the Web. Teachers could add annotations to provide additional context for any of the included pages. Students can move off-path following links within the included pages, before returning to the path. Extensions to Walden Paths used similarity measures to suggest alternative or additional pages that could be included in a path [12].
Metro Maps [39–41] proposed a method for the automated rather than manual construction of paths across documents. A set of candidate pathways through the documents are rated according to three metrics: coherence, coverage and connectivity. A document pathway is coherent if it contains a repeating set of terms across its documents, providing a thematic backbone. A document pathway has high coverage if introduces a high number of new terms across the documents. A set of pathways have high connectivity if they have a high number of intersections. The metrics can be weighted to tune the returned pathways.
In the cultural heritage domain the PATHS system [1,19] can be used for authoring and publishing paths across artworks in the Europeana collection. Each path had an associated topic which could be used to browse available paths. Deep Viewpoints [31] enabled citizens as well as heritage professionals to author scripts containing artworks from a museum collection. Each stage in the script, rather than being limited to a single artwork, could contain any number of artworks to support comparison across them. Scripts could contain questions as well as contextual information to elicit responses from followers of the script.
3 PIPE ORGANS KNOWLEDGE GRAPH
For the past three years, a Knowledge Graph has been under development to serve as a unified representation of historic pipe organs in Europe. The first iteration of the Knowledge Graph focuses on the history of pipe organs in the Netherlands. The main source document for building the Knowledge Graph was the Dutch Organ Encyclopedia, which consists of 15 volumes, published between 1997 and 2010. Microsoft Word documents of the encyclopedia were provided by its publisher, the National Institute for Organ Art (NIvO). Information on the organs included in the encyclopedia such as their name, builder and location were extracted from the documents using a combination of tools including Regular Expressions, Large Language Models, SPARQL Anything [9] and manual editing.
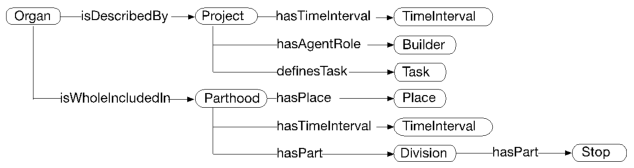
To define the extracted information, an ontology was developed to represent the types (i.e. classes) of entity found in the encyclopedia and relationships between them (i.e. properties). Key classes and properties of the ontology are shown in figure 2. In the figure, classes begin with a capital letter and are contained within a lozenge. Properties begin with a lowercase letter and are used to label an arrow showing the classes connected by the property.
Key classes and properties from the Knowledge Graph of pipe organs
Figure 2: Key classes and properties from the Knowledge Graph of pipe organs.
Each organ represented in the Knowledge Graph is of type Organ. Two main classes connected to the Organ class are Project and Parthood. An organ is connected to a project using the isDescribedBy property and to a parthood using the isWholeIncludedIn property. The properties have generic names taken from a higher-level ontology not specific to this domain.
An entity of type project is used to describe a building or maintenance activity undertaken on the pipe organ. Each project has an associated time interval, builder and task. An organ may have any number of building and maintenance activities, each represented as a project. The Parthood class represents the disposition (i.e. the setup or configuration) of the organ at a particular place and time. A disposition comprises one or more divisions. Each division is a physical part of the organ that contains some number of stops which control different pipes of the organ. Over time, an organ may have one or more dispositions, each with their own divisions and stops. Over time an organ may have dispositions in different places, for example, if the organ was moved and rebuilt in a different location.
The design of the ontology was motivated by a set of queries that the resulting Knowledge Graph could be used to answer. These queries were devised with advice and feedback from organ advisers, i.e. specialists in the care and restoration of pipe organs with extensive knowledge of their history. A set of nine such questions were defined, covering (i) searching for an organ based on its name, (ii) finding the builder of an organ, (iii) the original disposition of the organ, (iv) maintenance history of an organ, (v) disposition of the organ at a point in time, (vi) locations of the organ over time, (vii) organs associated with a location, (viii) work history of a specific organ builder, and (ix) organs built at a particular time.
4 USE OF THE PIPE ORGANS KNOWLEDGE GRAPH BY DOMAIN EXPERTS
To gain initial feedback on the Knowledge Graph and how it could be accessed using an existing browsing tool, two organ advisers used the LodLive interface (section 2.3, [5]) to search the Knowledge Graph and browse its content as a node-link visualisation. They were given five assignments to complete using the interface. The assignments were motivated by the questions used to guide the design of Knowledge Graph (see section 3) and involved: finding organs built by a certain builder, finding organs located in a particular city, finding the organs in a city built by a certain builder, finding the disposition of an organ, and finding when a builder built an organ.
The organ advisers encountered difficulties in completing the assignments. Although they were domain experts, they had difficulty translating their understanding to how the domain was represented in the Knowledge Graph. The main feedback received from the organ advisers was to design an interface that abstracted away from the structure of the data and present the information in a way which was more fitted to their terminology and practices.
Further discussion with a wider group of organ advisers following the evaluation identified two requirements for an interface to the Knowledge Graph. First, if should be straightforward to search for organs using any combination of the features indirectly connected to the Organ class via the Project and Parthood classes. For example, it should be straightforward to search for organs based on features such as builder, location, time, stops and divisions. For the purposes of search, this would essentially involve a re-representation of the Knowledge Graph into a simplified form with direct links from the organ to each of its features accessed via the Project and Parthood classes. Second, it should be straightforward, to get an overview of certain features of an organ. For the items in the maintenance history of the organ, represented as of type Project, this could be a simple table of maintenance activities in chronological order. This would represent spatially the chronological ordering of maintenance tasks that is not explicit in the Knowledge Graph. For the Parthood information of an organ, the organ advisers requested that similarly it should be straightforward to get an overview of all divisions and stops for a specific Parthood representation of an organ, and it should also be possible to view two parthood descriptions side-by-side. This was motivated by a common activity of organ advisers to compare two parthood specifications of the same organ or two parthood specifications from different organs to easily identify their similarities and differences in how they have been configured.
Further discussions with the organ advisers and other domain experts considered what additional challenges would need to be addressed to make the content of the Knowledge Graph usable by a more general audience. Two issues emerged. First, it was felt that the amount of content that could be browsed or returned in response to a query could be overwhelming for the casual user. Currently, the Knowledge Graph contains data on nearly 2000 pipe organs, and this is anticipated to increase significantly over the next year. Even subsets of the content generated from a query could return a large volume of results. For example, hundreds of pipe organs could be associated with a particular year, builder or structural feature such as a division or stop. The organ advisers could potentially play a role in addressing this challenge, selecting significant items associated for example with a builder, time or location.
Second, it was suggested that a more general audience may need additional context to interpret information about an individual organ or what is revealed in the similarities and differences between organs. Such context could be provided by the organ advisers, as experts in the domain. This process of adding context could be seen as like the role of a museum curator. A museum may have an online collection giving access via search or browsing to images and metadata of artworks held by the museum. This provides access to the collection but little interpretative support to the user. This can be contrasted with a physical or digital exhibition in which additional interpretation is provide in terms of the selection of items, their layout and associated signage and information panels.
5 PIPE ORGANS INTERFACE
Based on the feedback from the organ advisers, a new interface to the Knowledge Graph, called Pipe Organs, was designed and implemented as a Web Application communicating with the Knowledge Graph via an API. The Knowledge Graph was stored in a back end Linked Data Hub using a set of data transformers based on SPARQL Anything [9] to import data from source formats including JSON, XML and CSV. The resulting datasets are loaded as collections of JSON-LD files into the Link Data Hub. The Linked Data Hub provides a REST API which used MongoDB as its main data store. This can be used for retreiving JSON documents about any of the entity types stored in the Linked Data Hub, for example pipe organs and organ builders. All JSON documents stored in the Linked Data Hub are also replicated as RDF using the open source Blazegraph triplestore. This enables the dataset to be queried using SPARQL, for example retrieving all pipe organs made by a particular builder and/or located in a particular city.
The first aim of the new Pipe Organs app was to abstract away from the Knowledge Graph structures required to model the domain toward a representation aligned with the understanding and practices of domain experts. This impacted both how organs were searched in the Knowledge Graph by experts and how the information pertaining to one or more organs was presented. Faceted search for the experts was implemented to filter organs based on any of the features directly or indirectly connected to the organ entity in the Knowledge Graph. Tabular representations were used to display information about an organ or any set of organs at an appropriate level of abstraction. These are both illustrated in the following subsections.
The other two aims of the new design, emerging from discussions with the organ advisers, were to address issues for the more causal user of the archive namely, the potentially high volume of results that could be returned when searching or browsing the Knowledge Graph and the need for additional context for a more general audience. First, our approach to dealing with the potential volume of responses was to enable the organ advisers to construct paths (see section 2.6) as a way of creating simplified ways of navigating the Knowledge Graph. For example, paths can be constructed that provide an overview of the entire Knowledge Graph or parts of it, for example, an introduction to organs developed by a particular builder or found in a particular city. The interface for creating and sharing paths was developed as an extension of the Deep Viewpoints app [31] developed for the Citizen Curation of “scripts” that guided the user through a sequence of stages, each related to some number of artworks from a museum collection. The software was extended to deal with objects that were associated with a complex Knowledge Graph structure (as described in section 3) rather than the simple label information of an object (i.e. title, year and artist) as found in the Deep Viewpoints app.
Second, there can be challenges in understanding and interpreting the information presented about an organ due to a lack of contextual information. For example, a domain expert when viewing the build and disposition of an organ may understand why the organ is configured in a certain way or why certain changes have been made over time. This might be missed by the more casual user. For this reason, the path author can also add contextual information to any stage of the path giving additional interpretation of any organ or comparison or contrast of selected organs. Additional context of value to others could also potentially be crowdsourced from a broader community, beyond the domain experts, for example from a wider group of enthusiasts who have recently seen the organ or heard it played. For this reason, paths constructed by the organ adviser can, as well as providing information, also invite information from followers of the paths, such as answers to questions about the status and use of the organ. The next two subsections provide a walkthrough of how the app can be used to create and follow paths associated with the Knowledge Graph.
5.1 Following paths through the Knowledge Graph
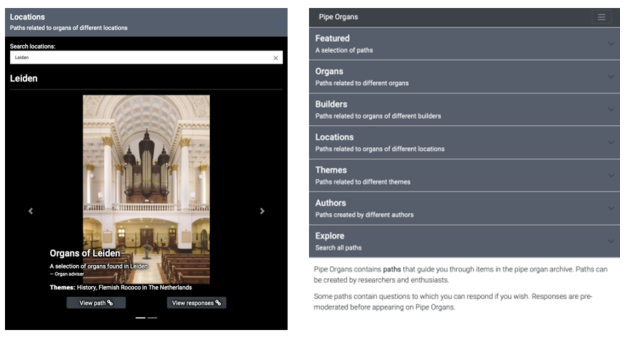
Figure 3 shows the homepage of the Pipe Organs app. The homepage is organised into several sections providing different ways of accessing the available paths. The top section displays featured paths. Other sections enable the paths to be accessed via other features such as organs included in the path, the builder or location of the organ, as well as the path author and any themes or tags the author may have associated with the path, such as music, history, etc. The content of the Organs, Builders and Locations panels is populated automatically from the Knowledge Graph. For example, a location search for Leiden would return paths containing organs that have Leiden as a location. Panels could be added related to any attributes of the organ (including divisions and stops). However, a decision was taken to restrict to attributes that could serve as a broadly understood entry point for a general audience. From the homepage, the user can choose to view any of the available paths. For any path that elicits responses (e.g, answers to questions), prior responses to the path can also be accessed.
The home page of the pipe ogans app
Figure 3: The home page of the pipe ogans app.
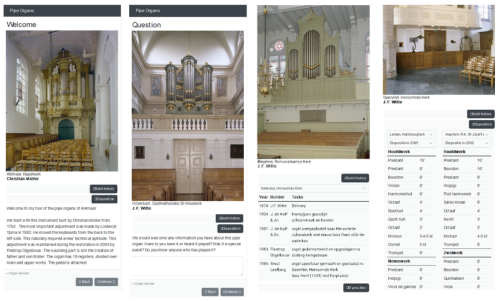
Figure 4 illustrates example stages from paths. The two main functions of stages within a path can be to either provide context for the path follower (figure 4, leftmost) or request information such as observations of the organ in situ (figure 4, second from the left). Information panels are automatically added from the Knowledge Graph to any stage that includes one or more organs. Below the image and label information for any organs included in the stage, two collapsible panels are included for build history and disposition information. The build history panel provides a chronological list of tasks carried out on the organ (figure 4, third from left). If the stage includes multiple organs, a drop-down menu is used to select the organ build history. The second panel shows the disposition information of the included organs (figure 4, rightmost). If a stage contains either a single organ with more than one disposition or more than one organ, then two dispositions can be selected and shown side-by-side, for easy comparison. Each disposition is presented as a table organised into divisions (e.g. Hoofdwerk, Nevenwerk, Zwelwerk). Within each division, the settings of the included stops (e.g. Prestant, Bourdon, Violin) are shown. A button at the bottom of each disposition table (not visible in the figure) enables it to be copied to a spreadsheet for further analysis, a common requirement of experts and enthusiasts.
Stages of Pipe Organ paths each showing Build History and Disposition information panels for the pipe organs included in that stage. From left to right: a statement providing additional context; a question eliciting further information; build history panel of one the pipe organs included in the stage, the disposition of two of the included organs at selected times
Figure 4: Stages of Pipe Organ paths each showing Build History and Disposition information panels for the pipe organs included in that stage. From left to right: a statement providing additional context; a question eliciting further information; build history panel of one the pipe organs included in the stage, the disposition of two of the included organs at selected times.
5.2 Curating paths through the Knowledge Graph
For the construction of paths, the expert user has a faceted search interface (figure 5, left) to filter the organs according to information about the organ represented in entities of type Project and Parthood according to the ontology (see section 3). To support the faceted search process, the information about each organ is retrieved using a SPARQL query (see section 2.3) and re-represented so that all features (builder, location, year, etc.) are direct attributes of the organ entity. Within the faceted search interface, the expert user can open any of the organs and preview the build history and disposition information as it will appear in any authored paths. The expert user can add any organs found in the Knowledge Graph to their personal collection. They can also use the app to construct paths as a sequence of stages (figure 5, right). Authored paths can be published on the home page. Alternatively, direct links to any path can be shared with others privately.
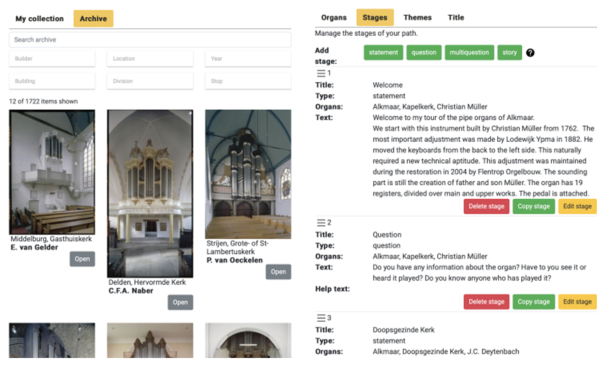
Faceted search of the organs Knowledge Graph (left) to collect items to be included in authored paths (right)
Figure 5: Faceted search of the organs Knowledge Graph (left) to collect items to be included in authored paths (right).
The organ advisers and causal users therefore have distinct ways of accessing the Knowledge Graph. Organ advisers access the archive directly according to features of the organs. Causal users access the content mediated in the form of curated paths that feature organs selected by the advisers, include additional contextual information and potentially crowdsource feedback from the wider casual audience.
6 USE OF PIPE ORGAN PATHS BY DOMAIN EXPERTS
Individual interviews were conducted with three organ advisers to demo the functionality of the app, give them the opportunity to try it for themselves and elicit feedback on how and whether the app could be used within their practice. Two of the organ advisers had previously used the LodLive interface to access the Knowledge Graph (see section 4). The tabular representation of information about the organ was well received, including the facility to view disposition information side-by-side. Two broad uses of the app were raised by organs advisers. First, the value of the app as a way of curating paths for a more general audience was recognized. Second, the organ advisers saw the value of the app for either personal note taking or using paths as a communication mechanism with other domain experts, describing restoration work carried out or other observations. This form of communication would be done by sharing links to paths rather publishing them for public view.
In terms of using paths to crowdsource feedback from a larger audience, the organ advisers noted that as well as using this mechanism to elicit observations it could also be used to also identify potential errors, omissions or out of date information in the Knowledge Graph from more knowledgeable members of the wider public. It was noted that both experts taking notes and sharing information among themselves as well as crowdsourcing responses from the public could be ways of eliciting future updates to the Knowledge Graph.
The organ advisers also suggested further additions to the Knowledge Graph that could be displayed in additional information panels. These were concerned with links to other resources rather than additional formal representation of the organ such as references to further literature, sound files of the organs being played and additional photographic sources. Faceted search was appreciated as a way of finding items for inclusion in the paths. It was suggested that faceted search be extended to distinguish current and previous locations of an organ and the type of role a builder has played in the construction or maintenance of the organ.
7 DISCUSSION AND CONCLUSION
This work has explored how experts in a heritage domain, without expertise in Knowledge Graph technology, could be supported in creating a layer of interpretation over a cultural heritage Knowledge Graph, usable by a casual audience. Paths were adopted as the mechanism domain experts could use to curate content from the Knowledge Graph. Knowledge associated with the organ was used to support experts in the faceted search of the archive. Paths contain related knowledge about the selected organs from the Knowledge Graph as well as authored contextual information and opportunities for followers of the path to provide feedback and observations. The following issues have emerged from the research. These issues will also be considered in future work alongside a larger-scale quantitative study of the processes of path making and path following.
Generality to other Cultural Heritage Knowledge Graphs. Although the app was developed to support a specific Knowledge Graph representing pipe organs, the approach could be generalized to other cultural heritage Knowledge Graphs. The vast majority of cultural heritage Knowledge Graphs represent cultural heritage objects of a particular type or scope plus additional knowledge which describes and/or is evidenced by the objects. The objects may take different forms such as artworks [13,47], photographs [10], historical documents [28], buildings [48], cultural historical artefacts in general [6,7] or in this case, pipe organs. The centrality of objects in cultural heritage Knowledge Graphs is unsurprising given that from a museological perspective the objects themselves have a “power of the real thing” that can bring coherence to events from the past [34]. Given the centrality of cultural objects in the Knowledge Graph, those cultural objects can be expected to play a central role in how users would want to access and use this knowledge as well as curate it for others. Paths focused around selected objects can therefore be expected to have utility in other cultural heritage domains.
The organs Knowledge Graph (section 3) represented two main perspectives on the organ and its history: the build history and dispositions of the organ. Essentially, these two perspectives differentiate events (i.e. tasks carried out on the organ) and states (i.e. the configuration of the organ at a time and place). This differentiation is afforded by the design patterns found in ontologies used in cultural heritage, as well as other domains. This includes the CIDOC CRM ontology [15] which promotes an event-based representation, differentiating objects from the events in which they feature and the DnS ontology [22] which differentiates objects (and other types of entity) from descriptions of them. Therefore, although build history and disposition are specific to the current domain, they reflect common ontology design patterns [21] used in Knowledge Graphs of cultural heritage to represent objects, states of those objects and their associated events. For example, the condition of an artwork or historical artefact at a point in time is commonly represented as a state, and events are commonly used to represent what happened to artefacts before and after they become archival items (e.g. use, ownership, loans, exhibitions). Presenting objects with associated states and events, as in the pipe organ app, can also therefore be expected to have wider utility beyond the current domain.
Manual versus assisted or automated path construction. Within the current app, all paths are human authored. Path authoring could potentially be assisted or automated. The system could learn from the patterns found in pre-existing human authored paths or from patterns found in the Knowledge Graph. Previous work (section 2.6) has investigated how measures such as similarity could be used to generate hypertext paths across pages. In our case, paths are being as used as a mechanism to create an additional layer of structure above the Knowledge Graph. The interconnectedness of the Knowledge Graph could provide new ways of assisting or automating path construction, for example, based on the cultural objects interconnected by people, places, times or events.
Incremental formalisation. An issue that emerged through discussion with the organ advisers is the role the software could play in capturing proposed changes or additions to the Knowledge Graph. Sources of potential changes could be captured during path authoring or in responses to paths elicited from the public and later formalised in updates to the Knowledge Graph. This could be seen as a method of incremental formalization [44] where knowledge collected and captured informally in text is later formalized in the Knowledge Graph. Hypertext tools applied to Knowledge Graphs could be seen as an example of what Millard and Anderson [2] describe a Hypertext for Knowledge Representation, with the concomitant challenge of what should be formalized and what should be “left in the text and links”. Although it is an open question where the boundary should lie, incremental formalization can at least ease transition across this boundary.
Spatial hypertext. The current system is used to build path structures over a Knowledge Graph. Cultural heritage objects are often presented to the public in the form of physical or virtual galleries. Monaco et al [30] describe how the results of a SPARQL query of a Knowledge Graph of artworks could be rendered through a template to create an online exhibition. From a spatial hypertext perspective [42], it could be possible to go further, where the spatial positioning of objects by a human author in a virtual gallery space could represent additional structure not currently reflected in the Knowledge Graph. This could represent knowledge found in curatorial narratives such as contrasts between artists or how the work of an artist changes over time, which could later be formalised in the Knowledge Graph.
Adaptive hypermedia and sculptural hypertext. The current paths are fixed and do not adapt based on the actions of the path follower. Within the hypertext field, research has considered how links between pages may be added as tasks are completed in educational adaptive hypermedia [32] or removed as choices are made by the reader of a sculptural hypertext [3]. Adaptive rather than fixed paths would blur the distinction between the author and reader, as the path through the Knowledge Graph is created by the addition or pruning of stages in response to the reader's actions. As would be the case for automated or assisted authoring, the interconnectedness of the Knowledge Graph could be used to guide the dynamic adaptation of paths based on connections to people, places, times and events.
ACKNOWLEDGMENTS
This work was supported by the EU's Horizon Europe research and innovation programme within the Polifonia project (grant agreement N. 101004746).
REFERENCES
Eneko Agirre, Nikolas Aletras, Paul Clough, Samuel Fernando, Paula Goodale, Mark Hall, Aitor Soroa, and Mark Stevenson. 2013. PATHS: A System for Accessing Cultural Heritage Collections.
Mark W. R. Anderson and David E. Millard. 2023. Seven Hypertexts. In Proceedings of the 34th ACM Conference on Hypertext and Social Media, 1–15.
Mark Bernstein, David E. Millard, and Mark .J. Weal. 2002. On writing sculptural hypertext. In Hypertext (HT’02).
Carlos Buil-Aranda, Martın Ugarte, Marcelo Arenas, and Michel Dumontier. 2015. A preliminary investigation into SPARQL query complexity and federation in Bio2RDF. In Alberto mendelzon international workshop on foundations of data management, 196.
Diego Valerio Camarda, Silvia Mazzini, and Alessandro Antonuccio. 2012. LodLive, exploring the web of data. In Proceedings of the 8th International Conference on Semantic Systems, 197–200.
Valentina Anita Carriero, Aldo Gangemi, Maria Letizia Mancinelli, Ludovica Marinucci, Andrea Giovanni Nuzzolese, Valentina Presutti, and Chiara Veninata. 2019. ArCo: The Italian cultural heritage knowledge graph. In The Semantic Web–ISWC 2019: 18th International Semantic Web Conference, Auckland, New Zealand, October 26–30, 2019, Proceedings, Part II 18, 36–52.
Valentina Anita Carriero, Aldo Gangemi, Maria Letizia Mancinelli, Andrea Giovanni Nuzzolese, Valentina Presutti, and Chiara Veninata. 2021. Pattern-based design applied to cultural heritage knowledge graphs. Semantic Web 12, 2: 313–357.
Enrico Daga, Luigi Asprino, Rossana Damiano, Marilena Daquino, Belen Diaz Agudo, Aldo Gangemi, Tsvi Kuflik, Antonio Lieto, Mark Maguire, Anna Maria Marras, and others. 2022. Integrating citizen experiences in cultural heritage archives: requirements, state of the art, and challenges. ACM Journal on Computing and Cultural Heritage (JOCCH) 15, 1: 1–35.
Enrico Daga, Luigi Asprino, Paul Mulholland, Aldo Gangemi, and others. 2021. Facade-X: an opinionated approach to SPARQL anything. Studies on the Semantic Web 53: 58–73.
Marilena Daquino, Francesca Mambelli, Silvio Peroni, Francesca Tomasi, and Fabio Vitali. 2017. Enhancing semantic expressivity in the cultural heritage domain: exposing the Zeri Photo Archive as Linked Open Data. Journal on Computing and Cultural Heritage (JOCCH) 10, 4: 1–21.
Souripriya Das. 2011. R2RML: RDB to RDF mapping language. http://www. w3. org/TR/r2rml/.
Pratik Dave, Unmil Karadkar, Richard Furuta, Luis Francisco-Revilla, Frank Shpiman, Suvendu Dash, and Zubin Dalal. 2003. Browsing intricately interconnected paths. In Hypertext (HT’03).
Victor De Boer, Jan Wielemaker, Judith Van Gent, Michiel Hildebrand, Antoine Isaac, Jacco Van Ossenbruggen, and Guus Schreiber. 2012. Supporting linked data production for cultural heritage institutes: the amsterdam museum case study. In The Semantic Web: Research and Applications: 9th Extended Semantic Web Conference, ESWC 2012, Heraklion, Crete, Greece, May 27-31, 2012. Proceedings 9, 733–747.
Anastasia Dimou, Miel Vander Sande, Pieter Colpaert, Ruben Verborgh, Erik Mannens, and Rik Van de Walle. 2014. RML: A generic language for integrated RDF mappings of heterogeneous data. Ldow 1184.
Martin Doerr. 2003. The CIDOC conceptual reference module: an ontological approach to semantic interoperability of metadata. AI magazine 24, 3: 75–75.
Lisa Ehrlinger and Wolfram Wöß. 2016. Towards a definition of knowledge graphs. SEMANTiCS (Posters, Demos, SuCCESS) 48, 1–4: 2.
Lina Eklund. 2020. A Shoe Is a Shoe Is a Shoe: Interpersonalization and Meaning-making in Museums – Research Findings and Design Implications. International Journal Of Human–Computer Interaction 36, 16: 1503–1513.
John H Falk and Lynn D Dierking. 2018. Learning from museums. Rowman & Littlefield.
Samuel Fernando, Paula Goodale, Paul Clough, Mark Stevenson, Mark Hall, and Eneko Agirre. 2013. Generating Paths through Cultural Heritage Collections.
Richard Furuta, Frank M Shipman III, Catherine C Marshall, Donald Brenner, and Hao-wei Hsieh. 1997. Hypertext paths and the World-Wide Web: experiences with Walden's Paths. In Proceedings of the eighth ACM conference on Hypertext, 167–176.
Aldo Gangemi and Valentina Presutti. 2009. Ontology Design Patterns. In Handbook on Ontologies.
Aldo Gangemi and Peter Mika. 2003. Understanding the semantic web through descriptions and situations. In OTM Confederated International Conferences" On the Move to Meaningful Internet Systems", 689–706.
Thomas R Gruber. 1993. A translation approach to portable ontology specifications. Knowledge acquisition 5, 2: 199–220.
Natali Helberger, Kari Karppinen, and Lucia D'acunto. 2018. Exposure diversity as a design principle for recommender systems. Information, Communication & Society 21, 2: 191–207.
Pieter Heyvaert, Ben De Meester, Anastasia Dimou, and Ruben Verborgh. 2018. Declarative rules for linked data generation at your fingertips! In The Semantic Web: ESWC 2018 Satellite Events: ESWC 2018 Satellite Events, Heraklion, Crete, Greece, June 3-7, 2018, Revised Selected Papers 15, 213–217.
Aidan Hogan, Eva Blomqvist, Michael Cochez, Claudia d'Amato, Gerard De Melo, Claudio Gutierrez, Sabrina Kirrane, José Emilio Labra Gayo, Roberto Navigli, Sebastian Neumaier, and others. 2021. Knowledge graphs. ACM Computing Surveys (Csur) 54, 4: 1–37.
Alexander Kirillovich and Konstantin Nikolaev. 2022. Adapting the LodView RDF Browser for Navigation over the Multilingual Linguistic Linked Open Data Cloud. In 2022 IEEE 9th International Conference on Sciences of Electronics, Technologies of Information and Telecommunications (SETIT), 143–149.
Mikko Koho, Esko Ikkala, Petri Leskinen, Minna Tamper, Jouni Tuominen, and Eero Hyvönen. 2021. WarSampo knowledge graph: Finland in the second world war as linked open data. Semantic Web 12, 2: 265–278.
Gary Marchionini. 2006. Exploratory search: from finding to understanding. Communications of the ACM 49, 4: 41–46.
Daniele Monaco, Maria Angela Pellegrino, Vittorio Scarano, and Luca Vicidomini. 2022. Linked open data in authoring virtual exhibitions. Journal of Cultural Heritage 53: 127–142.
Paul Mulholland, Adam Stoneman, Jason Carvalho, Enrico Daga, and Mark Maguire. 2023. Deep Viewpoints: Scripted Support for the Citizen Curation of Museum Artworks. In Proceedings of the 34th ACM Conference on Hypertext and Social Media, 1–11.
Catherine Mulwa, Seamus Lawless, Mary Sharp, Inmaculada Arnedillo-Sanchez, and Vincent Wade. 2010. Adaptive educational hypermedia systems in technology enhanced learning: a literature review. In Proceedings of the 2010 ACM conference on Information technology education, 73–84.
Heiko Paulheim. 2017. Knowledge graph refinement: A survey of approaches and evaluation methods. Semantic web 8, 3: 489–508.
Susan M. Pearce. 1990. Objects as meaning; or narrating the past. In Objects of Knowledge, S.M. Pearce (ed.). Althone Press, London, 125–140.
Susan M. Pearce. 1995. On Collecting: An Investigation into Collecting in the European Tradition. Routledge, London.
Giulia Renda, Marilena Daquino, and Valentina Presutti. 2023. Melody: A Platform for Linked Open Data Visualisation and Curated Storytelling. In Proceedings of the 34th ACM Conference on Hypertext and Social Media, 1–8.
Laurens Rietveld and Rinke Hoekstra. 2017. The YASGUI family of SPARQL clients 1. Semantic Web 8, 3: 373–383.
K. Ryding, J. Spence, S.A. Lovlie, and S. Benford. 2021. Interpersonalizing Intimate Museum Experiences. International Journal of Human–Computer Interaction, 2: 1–22.
Dafna Shahaf and Carlos Guestrin. 2010. Connecting the Dots Between News Articles. Proceedings of the 16th ACM SIGKDD international conference on Knowledge discovery and data mining.
Dafna Shahaf, Carlos Guestrin, and Eric Horvitz. 2012. Trains of Thought: Generating Information Maps. Proceedings of the 18th ACM SIGKDD international conference on Knowledge discovery and data mining
Dafna Shahaf, Carlos Guestrin, and Eric Horvitz. 2012. Metro Maps of Science. Proceedings of the 18th ACM SIGKDD international conference on Knowledge discovery and data mining.
Frank M. Shipman and Catherine C. Marshall. 1999. Spatial hypertext: An alternative to navigational and semantic links. ACM Computing Surveys 31, 4.
Frank M Shipman III, Richard Furuta, Donald Brenner, Chung-Chi Chung, and Hao-wei Hsieh. 1998. Using paths in the classroom: experiences and adaptations. In Proceedings of the ninth ACM conference on Hypertext and hypermedia: links, objects, time and space—structure in hypermedia systems: links, objects, time and space—structure in hypermedia systems, 267–270.
Frank M Shipman III and Raymond J McCall. 1999. Incremental formalization with the hyper-object substrate. ACM Transactions on Information Systems (TOIS) 17, 2: 199–227.
Robert Speakman, Mark Michael Hall, and David Walsh. 2018. User engagement with generous interfaces for digital cultural heritage. In International Conference on Theory and Practice of Digital Libraries, 186–191.
Adam Stoneman, Jason Carvalho, Enrico Daga, Mark Maguire, and Paul Mulholland. 2021. Uncomfortable Revelations: can citizen curation widen access to museums? Museum Ireland 28: 64–71.
Pedro Szekely, Craig A Knoblock, Fengyu Yang, Xuming Zhu, Eleanor E Fink, Rachel Allen, and Georgina Goodlander. 2013. Connecting the smithsonian american art museum to the linked data cloud. In The Semantic Web: Semantics and Big Data: 10th International Conference, ESWC 2013, Montpellier, France, May 26-30, 2013. Proceedings 10, 593–607.
Tabea Tietz, Oleksandra Bruns, Sandra Göller, Matthias Razum, Danilo Dessì, and Harald Sack. 2021. Knowledge Graph enabled Curation and Exploration of Nuremberg's City Heritage.
Hernán Vargas, Carlos Buil-Aranda, Aidan Hogan, and Claudia López. 2019. RDF explorer: A visual SPARQL query builder. In The Semantic Web–ISWC 2019: 18th International Semantic Web Conference, Auckland, New Zealand, October 26–30, 2019, Proceedings, Part I 18, 647–663.
Paul Warren and Paul Mulholland. 2020. A comparison of the cognitive difficulties posed by SPARQL query constructs. In International Conference on Knowledge Engineering and Knowledge Management, 3–19.
Ryen W White and Resa A Roth. 2009. Exploratory search: Beyond the query-response paradigm. Morgan & Claypool Publishers.
Mitchell Whitelaw. 2015. Generous interfaces for digital cultural collections. Digital humanities quarterly 9, 1: 1–16.
HJ Zhou, TT Shen, XL Liu, YR Zhang, Peng Guo, and Jianjun Zhang. 2020. Survey of knowledge graph approaches and applications. Journal on Artificial Intelligence 2, 2: 89–101.
Do you like what you are reading? Subscribe to receive updates.
Unsubscribe anytime