
The Interconnected Nature of Online Harm and Moderation: Investigating the Cross-Platform Spread of Harmful Content between YouTube and Twitter
Valerio La Gatta, Information Sciences Institute, University of Southern California, Los Angeles, California, USA (also with the University of Naples Federico II, Italy) · Luca Luceri, Information Sciences Institute, University of Southern California, Los Angeles, California, USA (also with the University of Applied Sciences and Arts of Southern Switzerland) · Francesco Fabbri, Spotify, Spain (work conducted while the author was at Pompeu Fabra University) · Emilio Ferrara, Information Sciences Institute, University of Southern California, Los Angeles, California, USA
Published in HT '23: 34th ACM Conference on Hypertext and Social Media · DOI: 10.1145/3603163.3609058 · License: © Copyright held by the owner/author(s). Publication rights licensed to ACM.
Authors: Emilio Ferrara, Francesco Fabbri, Valerio La Gatta, Luca Luceri
Keywords: Twitter, YouTube, cross-platform information diffusion, moderation interventions
Session: Social and Intelligent Media: Social Media Practices (Panel)
Conference: HT '23
Abstract
The proliferation of harmful content shared online poses a threat to the integrity of online information and the integrity of discussion across platforms. Despite the various moderation interventions adopted by social media platforms, researchers and policymakers are calling for holistic solutions. This study explores how a target platform could take advantage of content that has been deemed harmful on a source platform by investigating the behavior and characteristics of Twitter users responsible for sharing moderated YouTube videos. Using a large-scale dataset of 600M tweets related to the 2020 US election, we find that moderated Youtube videos are extensively shared on Twitter and that users who share these videos also endorse extreme and conspiratorial ideologies. A fraction of these users are eventually suspended by Twitter, but they do not appear to be involved in state-backed information operations. The findings of this study highlight the complex and interconnected nature of harmful cross-platform information diffusion, raising the need for cross-platform moderation strategies.
1 INTRODUCTION
Social media platforms play a significant role in shaping the modern digital information ecosystem by allowing users to contribute to discussions on a wide range of topics, including public health, information technology, and socio-political issues. However, the freedom of expression offered by these platforms, combined with lax moderation policies, can potentially threaten the integrity of these information ecosystems when harmful content, such as fake news, propaganda, and inappropriate or violent content, is shared and propagated across the digital population. Mainstream social media platforms like Facebook and Twitter attempt to preserve the integrity of their environments by enforcing conduct policies and deploying various moderation interventions to target both harmful content and the users responsible for spreading it. These interventions can include flagging, demotion, or deletion of content, as well as a temporary or permanent suspension of users. However, these moderation efforts are typically enacted in a siloed fashion, largely overlooking other platforms’ interventions on harmful content that has migrated to their spaces. This approach poses risks as any inappropriate content originating on a source platform can migrate to other target platforms, gaining traction with specific communities and reaching a wider audience. For example, cross-platform diffusion of anti-vaccine content on You Tube and Twitter has led to extensive amplification and virality on multiple platforms [7, 13]. Additionally, research has shown that moderation efforts on a source platform can foster the proliferation of harmful
content on target platforms [29]. For example, the removal of antivaccine groups on Facebook has been found to increase engagement with anti-vaccine content on Twitter [22]. Similarly, Buntain et al. [4] found that when You Tube decided to demote conspiratorial content, some Reddit communities pushed demoted videos on the platform making them go viral, effectively nullifying You Tube’s strategy. Furthermore, Ali et al. [3] found that users who got banned on Twitter or Reddit exhibit an increased level of toxicity on Gab. Overall, this highlights the need for cross-platform moderation strategies that consider the interconnected nature of the digital information ecosystem, and that the removal of content or suspension of users on one platform may not be sufficient in addressing the spread of inappropriate content across multiple platforms. Cooperation among social media platforms is therefore desirable but also practically valuable: knowing what content has been deemed inappropriate on another platform can inform moderation strategies, or help with the early detection of similarly harmful, or related content. Recent work demonstrated how cross-platform strategies can help with the moderation of radical content or inauthentic activities [11, 28], e.g., by tracking users’ activity on multiple platforms [3, 7, 22].
Contributions of this work
In this paper, we approach this problem from a different perspective. We consider You Tube (YT) and Twitter as the source and target platforms, respectively, and investigate the prevalence of moderated YT videos on Twitter, i.e., videos that are shared on Twitter but are eventually removed from You Tube. Also, we characterize Twitter users responsible for sharing YT videos—hereafter, You Tube mobilizers, as defined by [6]—across several dimensions, including their political ideology and potential engagement with fringe platforms. In particular, we aim to answer the following research questions (RQs):
RQ1: What is the prevalence, lifespan, and reach of moderated YT videos that are shared on Twitter?
RQ2: What are the characteristics of the mobilizers of moderated YT videos? And, are there any differences with the mobilizers of non-moderated YT videos?
RQ3: Do the mobilizers of moderated YT videos receive significant engagement from the Twitter population?
Leveraging a large-scale dataset related to the 2020 U.S. election [5], we observed that You Tube is the most shared mainstream social media platform on Twitter. By using the You Tube API to retrieve videos’ metadata, we found that 24.7% of the videos shared in the election discussion were moderated. We also found that these moderated videos spread significantly more than non-moderated videos and were shared more than content from other mainstream and fringe social media platforms, such as Gab and 4chan. When examining Twitter users sharing YT videos, we discovered that the users sharing moderated videos mostly engaged with YT content via retweets, while the users sharing non-moderated videos actively shared YT content in their original tweets or replies. We found that more than half of the users in the former group were suspended by Twitter, but surprisingly, there were more accounts involved in information operations—as identified by Twitter—in the latter group. Additionally, we found that the users sharing moderated
YT videos supported Trump and promoted election fraud claims, while the users sharing non-moderated videos explicitly denounced Trump and had a more uniform political leaning, including users supporting both Biden and Republican representatives who did not endorse Trump’s political campaign. Finally, we found that users sharing moderated and non-moderated YT videos tend to interact within their group and have similar interaction patterns in terms of retweets, suggesting the formation of fragmented communities resembling echo chambers. Overall, our findings provide insights into the complex dynamics of crossplatform information diffusion, highlighting the need for a more holistic approach to moderation.
2 RELATED WORK
2.1 Cross-platform moderation
To preserve the integrity of their own environment, most mainstream social media platforms deploy diverse intervention strategies, targeting both inappropriate content (e.g., through flagging, demotion, or deletion) and the users (e.g., through temporary or permanent suspension) who share it. However, the effectiveness of these interventions is increasingly questioned by researchers and policymakers who demand for a proactive and holistic effort rather than the current siloed and retroactive solutions [8, 26, 34]. Indeed, even if the moderation intervention is effective on an isolated platform, it might trigger harmful activities on other platforms. For instance, Ali et al. [3] showed that, following the suspension of radical communities on Reddit, users migrated to alternative platforms becoming more active and sharing more toxic content. A similar pattern emerged following the de-platforming of Parler, where users migrated to other fringe social media platforms such as Gab and Rumble [16]. In addition, Russo et al. [29] have found that the antisocial behaviors of migrated users may spill over onto the mainstream one through other (non-radical) users active across platforms. Accordingly, Mitts et al. [22] discovered that when Facebook banned some anti-vaccine groups, the toxic content promoted by these groups resonated on Twitter. Also, during the 2020 U.S. election, videos removed from mainstream platforms were republished on the (low-moderated) Bit Chute platform [31]. The above-mentioned studies raise the need for proactive and collaborative moderation approaches to guarantee the integrity of the whole digital information ecosystem. In this paper, we investigate the potential benefits of social media platforms to share information concerning their moderation interventions by studying the users who post moderated YT videos on Twitter.
2.2 Cross-platform spread of You Tube content
The diffusion of multimodal information across platforms (e.g. images, videos) is particularly threatening, as multimedia content has been proven to be much more attractive and credible than only textual posts [15]. In particular, the cross-posting of (harmful) video content across multiple social media platforms is a well-documented problem in the scientific literature [14, 34]. For example, a considerable number of suspicious YT videos were shared on Twitter to raise skepticism about the COVID-19 vaccination campaign [25]. Cinelli et al. [7] show that antivaccine YT videos that were shared
on Twitter experienced an increased level of visibility and dissemination on You Tube, whereas Nogara et al. [24] recognized You Tube as one of the most prolific channels used by the notorious Disinformation Dozen to spread Covid-19-related conspiracies on Twitter. Similarly, Golovchenko et al. [14] have shown that the Internet Research Agency (IRA) leveraged You Tube content in its 2016 Twitter propaganda campaign, and more recently Wilson and Starbird [34] have also reported the adoption of YT content to support anti-White Helmet operations in 2020. In general, the studies mentioned above demonstrate that harmful YT content is not only active within the source platform but can flourish in other target platforms, often with the intention of influencing vulnerable and fringe communities. In such a scenario, the entities who mobilize and disseminate harmful content can take on various forms, i.e., bots, sockpuppets, influential elites, or even information consumers susceptible to misinformation and conspiracies. In this paper, we study the characteristics of these entities focusing on Twitter users who share moderated YT videos and investigating their similarities and differences with the users who share nonmoderated YT content.
3 METHODOLOGY
In this section, we describe the data used in the analysis and detail the methodology used to understand the prevalence of YT moderated content on Twitter (RQ1) and to characterize users who share moderated YT videos (RQ2 and RQ3).
3.1 Data Collection
We used a dataset of election-related tweets collected using Twitter’s streaming API service in the run-up to the 2020 US election [5]. In particular, we focus on the six months, from June 2020 to December 2020, covering the last part of the electoral campaign, as well as the aftermath of the election, which was characterized by the widespread diffusion of misleading claims and conspiracies on the integrity of the election results [12, 32]. In this period of observation, we collected more than 600M tweets (including original tweets, replies, retweets, and quotes) shared by 7.5M unique users.
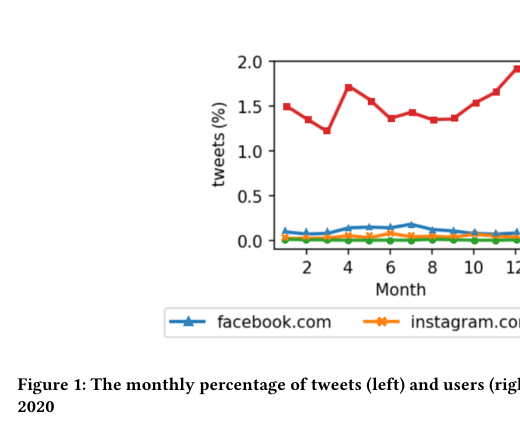
In particular, tweets that include YT videos account for 0.65% (3.9M) of the collected messages. Note that we do not consider URLs to YT channels. Fig. 1 shows that the fractions of tweets (resp. users) sharing YT content are consistently larger than tweets (resp. users) pointing to other mainstream social media, which is in line with [1, 6]. In addition, in both cases, we observe an increasing trend towards our observation period (the second half of 2020), possibly because of the approaching election (November 3rd, 2020). In total, 527k YT videos were shared on Twitter by 830k users. Through the You Tube API, we could retrieve various video metadata, including the ability to determine if a particular video was removed from the platform. We find that, among all YT videos, 24.7% (130k out of 527k) were moderated. Furthermore, before the intervention, these videos were shared on Twitter by 34.5% (287k out of 830k) users. Finally, we collect YT video metadata of nonmoderated videos, including the video title, description, tags, and the channel that published the video. Interestingly, You Tube does not allow one to collect metadata for moderated videos, including the date when the intervention occurred as well as the reason(s) for the moderation intervention. However, we can safely assume that a video is still online when shared in an original tweet, as this requires the user to report the video URL in the Twitter post.
3.2 Identifying mobilizers of moderated You Tube videos
To identify the mobilizers of moderated YT videos, we first consider the most active YT mobilizers, as our objective is to investigate the characteristics and behaviors of users who repeatedly (rather than occasionally) post YT content. For this reason, we consider users who shared at least 5 YT videos on Twitter, which results in a set of 113k Twitter users. Then we partition this list of YT mobilizers into two groups based on the volume of shared moderated YT videos. For each user u, we define the ratio of moderated videos (rmv(u)) as the proportion of moderated YT videos out of the total number of YT videos shared by u during our observation period. Based on this metric, we define nonmoderated YT video mobilizers (NMYT)
Figure 1: The monthly percentage of tweets (left) and users (right) who shared a link to a mainstream social media platforms in 2020
5000
0
0.0 0.2 0.4 0.6 0.8 1.0
rmvratio
(a)
of tweets (1st week)
20
10
YT video status
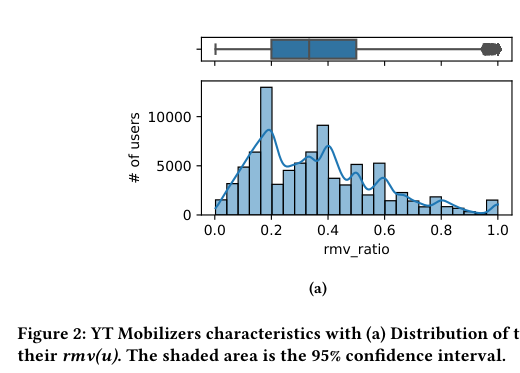
as the users with an rmv(u) = 0, which results in 25.4k Twitter accounts. Then, observing the distribution of the ratio of moderated videos (Fig. 2a), we define the mobilizers of moderated YT videos (MYT) the users with a rmv(u) ≥0.5, that is, all users with a rmv(u) higher than the 75th percentile of the distribution, resulting in 14.5k Twitter accounts. This threshold allows us to focus on users particularly prone to sharing moderated videos, thus excluding from the analysis those who sporadically share moderated YT content. To validate our choice, we examine whether the accounts sharing moderated videos are still active on Twitter or were suspended. Fig. 2b shows the percentage of suspended users as a function of rmv (u). We note that the percentage of suspended users does not increase after sharing more than 50% of moderated videos. Also, the probability of being suspended by Twitter is positively correlated with the value of rmv (u) (Spearman correlation = 0.451).
4 RESULTS
4.1 Prevalence of moderated You Tube videos on Twitter (RQ1)
To answer RQ1, we perform an analysis of the consumption of YT videos on Twitter comparing moderated vs. nonmoderated YT videos. It is worth noting that moderated videos tend to be shared for
% of suspended users
60
50
40
30
0.0 0.2 0.4 0.6 0.8 1.0
rmvratio
(b)
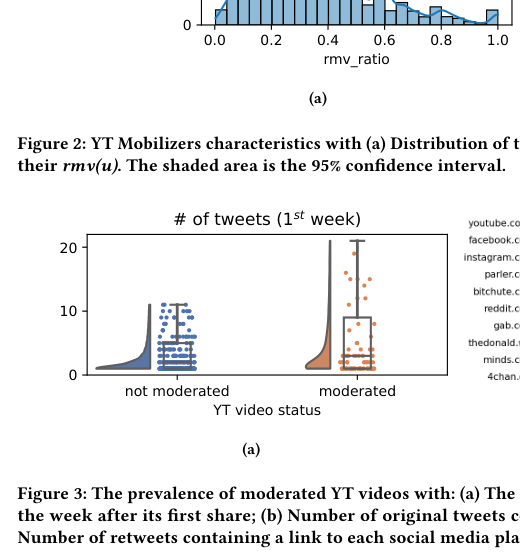
a limited number of days (20 days on average), while nonmoderated videos have a longer lifespan (50 days on average), likely due to YT moderation interventions. Therefore, to perform a fair comparison, we examine the number of tweets including the YT videos during the first week after its first share on Twitter. Fig. 3a shows the distributions of the number of tweets for nonmoderated and moderated videos. It can be noted how moderated videos distribution is characterized by a right heavy-tail, meaning that moderated videos when posted for the first time on Twitter, generate a higher volume of sharing activity with respect to nonmoderated videos.∗This finding is consistent with the previous study by Locatelli et al. [19], who analyzes Covid-19 YT videos and shows that moderated videos prompt more active engagement from viewers. To further explore the prevalence of moderated YT content on Twitter, we compare the volume of interactions with content originating from other social media platforms. Specifically, Fig. 3b and Fig. 3c show the volume of tweets and retweets of moderated YT videos, URLs pointing to mainstream online social networks, and URLs redirecting to fringe platforms [33]. We observe that the volume of tweets linking moderated YT videos alone is greater than
∗A Mann–Whitney test (p-value< 0.01) was performed to validate this finding.
Figure 2: YT Mobilizers characteristics with (a) Distribution of the rmv(u); (b) Percentage of the suspended users with respect to their rmv(u). The shaded area is the 95% confidence interval.
(a) (b) (c)
Figure 3: The prevalence of moderated YT videos with: (a) The distribution of the number of tweets sharing each video during the week after its first share; (b) Number of original tweets containing a link to each social media platform (Log-scale); (c) Number of retweets containing a link to each social media platform (Log-scale)
original
quotes
1.00
1.00
0.75
0.75
0.50
0.50
0.25
0.25
0.00
0.00
NMYT MYT
NMYT MYT
user group
user group
the volume of tweets pointing to any other social media platform. According to [6], we find that fringe content supplied by Parler and Bit Chute is outnumbered by the content provided by mainstream platforms.
Findings and Remarks. Addressing RQ1, we discovered that moderated You Tube videos were widely shared on Twitter during the run-up and aftermath of the 2020 US election. In addition, moderated videos received a higher volume of interactions in the early days of their lifespan. Additionally, moderated YT content alone received more engagement than whole content from other mainstream platforms.
4.2 You Tube Mobilizers (RQ2)
To address RQ2, we characterize YT mobilizers that share moderated (MYT) and non-moderated videos (NMYT) and investigate whether these users show significantly different behaviors and characteristics across three dimensions:
• Cross-Posting Activity: we explore the sharing activity that users perform on Twitter, including their cross-posting of content originating from other mainstream and fringe platforms;
• Trustworthiness of the account: we examine whether MYT and NMYT users are verified accounts or bots, also looking at their account status (active vs. suspended) and potential involvement in information operations;
• User Interests: we investigate the political leaning and topics of interest of mobilizers, both on Twitter and YT.
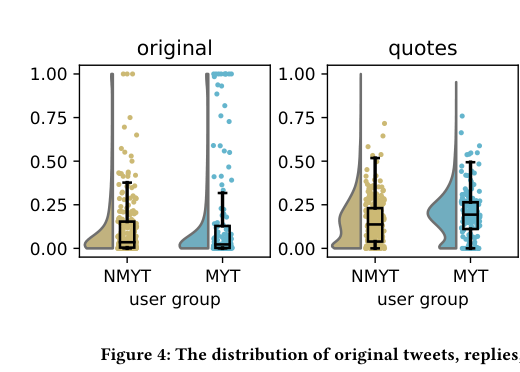
4.2.1 Cross-Posting. We consider all the possible sharing activities that a user can perform on Twitter, i.e., posting an original tweet, commenting on a tweet with a reply, re-sharing a tweet with or without a comment via retweet or a quote, respectively. From Fig. 4 it can be seen that while exhibiting similar behaviors in posting original tweets, MYT users retweet more and reply less than NMYT users. To further characterize this discrepancy in the use of retweets, we examine the proportion of re-shared tweets embedding links to other web domains (beyond You Tube). We find that MYT users often retweet content linking to external sources, i.e., 50% of their retweets on average contain URLs with respect to 28% for NMYT
reply
retweet
1.00
1.00
0.75
0.75
0.50
0.50
0.25
0.25
0.00
0.00
NMYT MYT
NMYT MYT
user group
user group
mobilizers. This analysis suggests that the activity of NMYT users is more diversified on Twitter, while MYT users tend to passively consume and spread (through retweets) the content they see on Twitter, especially if such content links to external resources. To further characterize the two groups of mobilizers, we consider how they engage with YT videos on Twitter. Specifically, we aim at understanding whether users passively interact with YT videos (e.g., through retweets) or proactively share them (e.g., in their original tweets). To this end, we define users as producers (resp. consumers) of a YT video if their first share of that video is an original tweet or a reply (resp. retweet). Then, we define prodratio as the proportion of YT videos produced by a user out of the total number of videos with which he/she engages. It is worth noting that with “video producer” we do not imply that the user is the publisher of the video on YT. Interestingly, we find that the mobilizers in both groups are either mostly producers (prodratio > 80%), or mostly consumers (prodratio < 20%) of YT videos. Specifically, we count 15,761 (62.1%) producers and 4,439 (17.4%) consumers in the NMYT group, while there are 4,630 (31.9%) producers and 3,742 (25.8%) consumers belonging to the MYT group. Fig. 5a shows the distribution of the prodratio in both groups. On the one hand, we find that NMYT mobilizers are mainly producers, that is, the 25 percentile of the prodratio distribution is 0.50. However, the MYT group includes the same number of producers and consumer accounts. This result is consistent with our previous finding and confirms the tendency of MYT users to passively retweet content compared to NMYT accounts, which actively participate in the discussion through replies or quotes. Furthermore, we investigate how mobilizers engage with content from other social media platforms. In particular, we target mainstream platforms, i.e., Facebook, Instagram and Reddit, and the fringe platforms outlined in Fig. 3b. We define the extreme ratio as the fraction of extreme URLs out of the total number of tweets shared by each user. Fig. 5c shows that the MYT and NMYT mobilizers have similar distributions in terms of mainstream ratio (p-value > 0.01 with a Mann-Whitney test). Taken together, the MYT and NMYT mobilizers share the same percentage (3.3%) of mainstream content on average, and no user posts more than 15% of tweets linking other
Figure 4: The distribution of original tweets, replies, retweets and quotes for NMYT and MYT mobilizers
mainstream social media platforms. However, Figure 5b shows that MYT users engage with fringe platforms much more than NMYT mobilizers. In fact, the distribution of their extreme ratio is different according to a Mann-Whitney test (p-value< 0.01), even if they have similar mean values, that is, 0.5% and 0.7% for NMYT and MYT mobilizers, respectively. In general, this analysis highlights that the two groups of mobilizers do not show any difference when interacting with mainstream social media platforms, while MYT mobilizers share more content from low-moderated online spaces than NMYT users, suggesting a form of endorsement of extreme ideas pushed on fringe platforms [33].
4.2.2 Trustworthiness. Here, we investigate the nature and status of the accounts in the two groups of mobilizers. Given the pivotal role that political elites, bot accounts, state-backed trolls have in orchestrated campaigns and (mis)information operations [10, 14, 21, 24, 35], we aim at identifying the entities pushing moderated or nonmoderated YT videos on Twitter. To this end, we use Botometer [36] and Twitter API to assess whether our mobilizers are automated or verified accounts, respectively. As shown in Figure 6, we find that both groups include very few verified accounts (268 and 19 in the
NMYT and MYT groups, respectively) and bots (2, 234 and 586 in the NMYT and MYT groups, respectively). Next, we examine whether users in the two groups of mobilizers were suspended by means of Twitter moderation interventions. Indeed, during the 2020 US election, the platform made an increased effort to ensure the integrity of discussion by adding warnings to suspicious or misleading content, as well as suspending accounts involved in information operations [20, 30]. From our perspective, we are interested in understanding whether and to what extent the accounts of the MYT and NMYT mobilizers were moderated by these actions. We find that accounts are suspended in both groups but in different proportions. Fig. 6 shows that 53.8% of MYT mobilizers (7,793 accounts) are moderated by Twitter, while 31.4% of NMYT users (7,984 accounts) are suspended. In addition, we further explore whether the (suspended) accounts are involved in state-backed information operations (in short Info Ops) on Twitter. As reported in Figure 6, we find that a minority of mobilizers (599 accounts in total) are involved in these campaigns and, interestingly, NMYT users are more involved than MYT users (2.2% of MYT against just 0.2% of NMYT). Overall, this analysis suggests that
(a) (b) (c)
Figure 5: The distribution of prodratio, extreme ratio and mainstream ratio for NMYT and MYT mobilizers
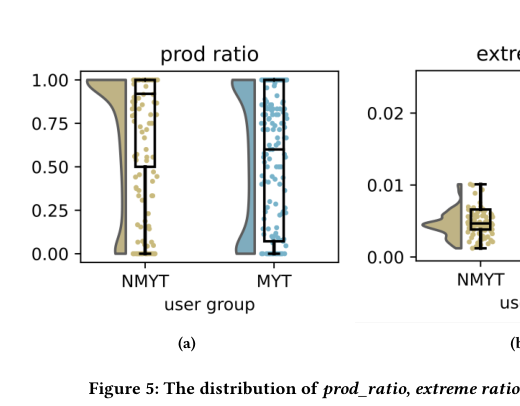
Figure 6: The number of accounts in each mobilizer group that were verified, bots or suspended. The columns are as follows: “Total Accounts” is the total number of accounts in each group. “Total Videos” is the number of unique YT videos shared by each group. “Verified Accounts” is the number of verified accounts in each group. “Bot Accounts” is the number of accounts labeled as a bot by the Botometer API in each group. “Suspended Accounts” is the number of accounts in each group that were later suspended by Twitter. “Info Ops Accounts” is the number of (suspended) accounts involved in information operation in each group
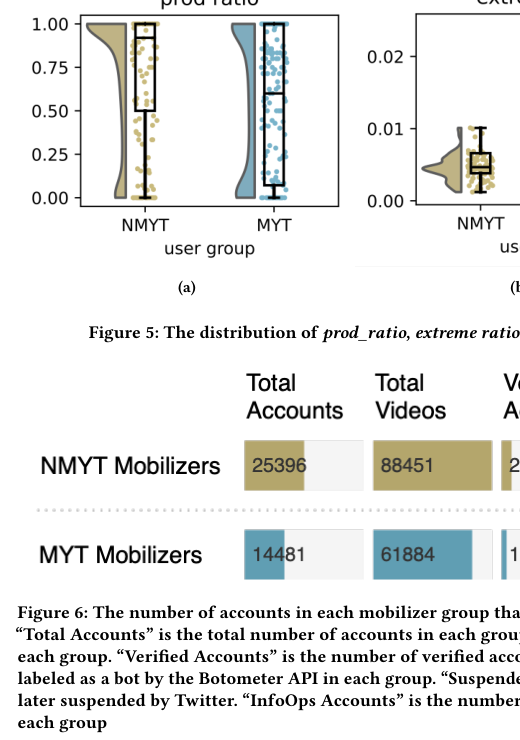
Table 1: Most shared hashtags and YT video keywords by NMYT and MYT mobilizers

NMYT Mobilizers MYT Mobilizers
#putinspuppet #krakenteam #trumpvirus #chinebitchbiden #resignnowtrump #demonrats #trumplies #evidenceoffraud #traitorinchief #bestpresidentever45 #gojoe #arrestfauci #trumpkillus #trumpwon #weirdotrump #trumppatriots
Twitter hashtags
barkhuff dan rsbn bernie sander bobulinski lincoln censored rainbow christina bobb loyalty fitton cnn spoiled incompetence tucker carlson
You Tube keywords
even though MYT mobilizers violated Twitter policies, they are not involved in state-backed orchestrated campaigns during the election.
4.2.3 User Interests. We now turn our attention to the content shared by MYT and NMYT mobilizers. As the data under analysis relate to the U.S. 2020 Presidential election, we expect that the discussion resonates with political topics, especially regarding the electoral campaign of the candidates, as well as the heated discussion around the alleged evidence of fraud during the aftermath of the election. Also, we focus on the political orientation of the users under analysis and on their potential connection with conspiratorial and fringe theories. To explore the general interests of MYT and NMYT mobilizers, we compare the hashtags of their tweets, as well as the descriptions of the YT videos they share on Twitter. To this end, we apply SAGE [9] to find the most distinctive hashtags and keywords for the tweets and video descriptions, respectively, shared by the two groups. It is worth to note that for MYT users we only took into account the non-moderated videos as the You Tube API cannot retrieve metadata related to moderated content. Table 1 reports the keywords and hashtags extracted by SAGE. We observe that MYT users are Trump supporters, as shown by the hashtags #bestpresidentever45, #demonrats, and they also sustain his allegation of voter fraud after the electoral count, as seen by the hashtags #krakenteam, #trumpwon. On the contrary, NMYT mobilizers explicitly despise Trump, as can be seen by the hashtags #trumpvirus, #traitorinchief, but their political orientation is not as clear as for MYT users. Indeed, #gojoe is the only pro-Biden hashtag in the NMYT’s top-50 hashtags. Overall, the keywords extracted from the descriptions of the YT videos align with the Twitter hashtags of the two groups. However, they do not communicate positive or negative sentiment but usually refer to (groups of) people who publicly stated their political preferences. For example, NMYT Mobilizers shared several videos related to the lincoln project and its ad starring Barkhuff Dan explicitly
saying “I can see Trump for what he is — a coward. We need to send this draft-dodger back to his golf courses”. It is worth noting that the Lincoln project is run by Republicans opposing Trump, which supports our intuition that NMYT users are not always Biden supporters. On the contrary, the MYT mobilizers support for Trump is clear also from their shared videos mentioning Christina Bobb, who has been close to Trump’s legal team that tried to overturn the result of the Presidential election, and Tucker Carlson, who has recently been nicknamed as Trump’s heir.†
To further investigate the political orientation of users, we leverage the political leaning score assigned by Media Bias Fact Check to several news outlets and, consistent with previous work [12, 27], measure user political orientation by averaging the scores of the domains they share on Twitter during the observation period. Fig. 7a and 7b show the top-10 domains shared by YT mobilizers and the political leaning distribution of MYT and NMYT users. The former group includes several far-right users (the median of the distribution is 0.47) who mostly share news from breitbart.com and thegatewaypundit.com, which are known to promote conspiracy theories and publish extreme conservative content [18, 23]. In contrast, the latter group includes less extreme and more liberal users. However, the political lean distribution of the NMYT group is bimodal (the larger mode is −0.27 and the smaller one is 0.41) and a small subset of these mobilizers shows an extreme conservative ideology. This result is further confirmed by looking at the top-10 domains of MYT mobilizers, including Foxnews.com, which is also shared frequently by the NMYT group, and forbes.com, which is a center-right news outlet.
Findings and Remarks. In response to RQ2, we found that MYT users tend to passively retweet what they see on Twitter rather than actively posting original tweets or replies. In addition, they are usually suspended on Twitter but are not involved in information operations. Finally, when assessing the (political) interests, we found that MYT are far-right supporters and backed Trump during the 2020 US election, while the political leaning of NMYT users is less extreme and more diverse.
5 ENGAGEMENT TOWARDS MOBILIZERS OF MODERATED YOUTUBE VIDEOS (RQ3)
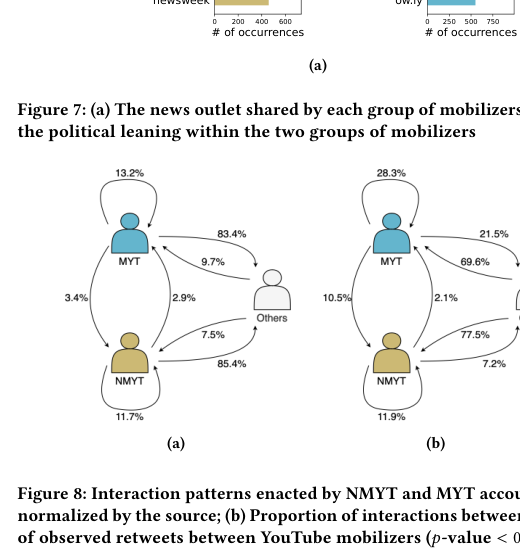
To respond to RQ3, we analyze the interaction patterns enacted by MYT and NMYT mobilizers by looking at the intra- and intergroup retweets exchanged by the users. Furthermore, we also consider the group of all other users (750k Twitter accounts) who shared at least one YT video and, by definition, do not fall in the category of YT mobilizers. As the number of users in the three groups is different, we do not compare the absolute numbers of intra- and intergroup retweets. For this reason, we normalize the number of interactions by source (i.e., the total number of retweets that the group performs, see Fig. 8a) or by target (i.e., the total number of retweets that the group receives, see Fig. 8b). On the one hand, we observe that the MYT and NMYT mobilizers generate the same relative amount of intragroup retweets, 13.2% and 11.7%, respectively, and intergroup retweets,
†https://www.theguardian.com/media/2020/jul/12/tucker-carlson-trump-foxnews-republicans
NMYT Users
MYT Users
nytimes
breitbart
cnn
pscp.tv
washingtonpost
thegatewaypundit
nbcnews
foxnews
politico
nypost
theguardian
rumble
thehill
theepochtimes
businessinsider
thefederalist
forbes
whitehouse.gov
rawstory
donaldjtrump
yahoo
washingtonexaminer
newsweek
ow.ly
0 200 400 600
0 250 500 750
of occurrences
of occurrences
(a)
(a) (b)
3.4% and 2.9%, respectively. On the other hand, Fig. 8b highlights that the two groups are engaged differently when considering the proportion of retweets they receive, i.e., 28.3% of the retweets received by MYT users are from accounts of the same group and only 2.1% are from the NMYT mobilizers. However, NMYT mobilizers tend to retweet both groups with the same frequency (11.9% NMYT to NMYT and 10.5% MYT to NMYT). This result indicates that MYT users tend to retweet and be retweeted more within their group than between groups. Finally, we can also notice that users in the Others category retweets MYT and NMYT mobilizers almost in the same way. This observation emphasizes that the level of user activity is not informative in characterizing interactions between NMYT users and the rest. To further validate our results, we compare the observed number of retweets to a null model, which assumes that interactions occur by chance. Specifically, we randomize the users’ assignment to the three groups (i.e., NMYT, MYT, and Others) and compute the mean and standard deviation of the interactions between the groups for 100 iterations. We then compute the z scores to compare the observed retweets with the expected number of retweets from the
NMYT Users MYT Users
0.10
0.08
density
0.06
0.04
0.02
0.00
1.0 0.5 0.0 0.5 1.0
political leaning
(b)
NMYT MYT Others
2
2.64 -2.80 -1.37
1
0
-2.88 2.84 -1.99
1
-2.48 -2.95 1.09 2
NMYT MYT Others
(c)
null model. Fig. 8c indicates that the observed pattern of retweeting behavior among mobilizers is consistent with the principle of homophily. Specifically, both mobilizer groups were found to have a higher number of retweets within their respective groups and a lower number of retweets across groups than would be expected by chance, i.e., z> 2.5 and z< −1.5, respectively.
Findings and Remarks. As for RQ3, we found that the MYT and NMYT groups exhibit strong group cohesion and are equally engaged by the Twitter audience. However, MYT users are not reciprocated by NMYT users.
6 DISCUSSION
6.1 Contributions
In this article, we studied the Twitter discussion around (video) content that is deemed harmful on You Tube. Leveraging an unprecedented large-scale dataset of 600M tweets shared by more than 7.5M users, we discovered an unexpectedly high number of
Figure 7: (a) The news outlet shared by each group of mobilizers (we omit the .com extension for brevity) ; (b) the distribution of the political leaning within the two groups of mobilizers
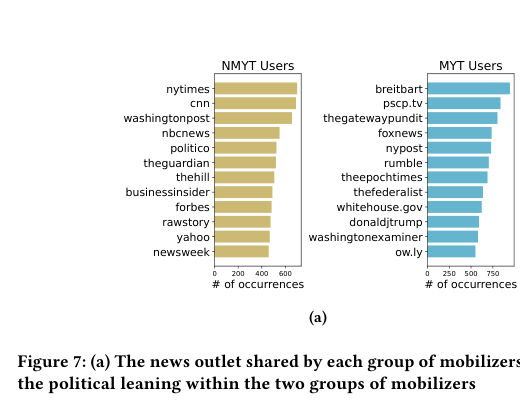
Figure 8: Interaction patterns enacted by NMYT and MYT accounts: (a) Proportion of interactions between You Tube mobilizers normalized by the source; (b) Proportion of interactions between You Tube mobilizers normalized by the destination; (c) Z-scores of observed retweets between You Tube mobilizers (p-value < 0.01)
moderated YT videos shared on Twitter during the 2020 US election. Overall, moderated videos were shared more than nonmoderated ones and received far more attention than content from fringe social media platforms. Moving beyond previous work, we investigated the characteristics of the Twitter users responsible for sharing both moderated and non-moderated YT videos. On the one hand, we found that users sharing moderated content tend to passively retweet what they see on Twitter rather than actively posting original tweets or replies. On the other hand, the mobilizers of nonmoderated videos actively share YT videos in their original tweets. Overall, most of the users were regular Twitter accounts rather than bots or state-sponsored actors, and, even if we did not find any involvement in information operations, Twitter suspended more than half of the moderated video mobilizers. Furthermore, we found that the mobilizers of moderated YT videos are far-right supporters and sustained Trump during the 2020 US election. By contrast, the political preference of the mobilizers of non-moderated YT videos is more diverse since users in this group range from Biden supporters to other Republican representatives who did not endorse Trump’s political campaign. Finally, we studied the interactions between the mobilizers of moderated and non-moderated videos and discovered that both groups exhibit strong group cohesion and are engaged similarly to the general Twitter audience.
6.2 Limitations
There are a number of limitations to our study. First, neither Twitter nor You Tube provides any additional information on account suspension and video moderation, and the timing of their interventions is also unknown. Therefore, there is no guarantee that YT videos were still online when reshared through retweets on Twitter, but we can confidently assume they were not moderated yet when shared in an original tweet. Furthermore, we acknowledge that our analyzes, as in several previous works [17, 19], could be biased towards moderated YT content that includes not only videos that violate You Tube policies but also those removed by their publishers for any reason. Second, we overlooked the YT channels shared on Twitter to safeguard our analysis from Twitter users who just advertise their own (or others) You Tube channel [2]. However, this choice might prevent us from considering another potential source of harmful YT content on Twitter. Third, the partition strategy to define the two groups of mobilizers is quite conservative, since we considered Twitter users who never share moderated videos and those who mostly share moderated videos.
6.3 Conclusions and Future Works
Our study has two major takeaways: first, moderated YT videos are widely shared on Twitter, and users who (passively) share those endorse extreme and conspiratorial ideas. From a broader perspective, we have shown how harmful content originating in a source platform significantly pollutes discussion on a target platform. Although more research is still needed, we conjecture that sharing information about the interventions taken would improve our understanding of cross-platform harmful content diffusion and benefit all entities within the information ecosystem. For instance, in the You Tube-Twitter cross-posting scenario considered in this paper,
You Tube moderation activity can benefit both parties of the cooperation: on the one hand, Twitter has the opportunity to (early-)detect intra-platform harmful activities; on the other hand, You Tube can further improve its moderation based on the cross-platform signals tied with harmful YT content diffusion on Twitter. Second, the mobilizers of the moderated YT videos appeared to be regular Twitter users who do not necessarily share content from fringe platforms. This suggests that cross-posting (harmful) cross-platform content is participatory [20] and research in this field should not only target bots and trolls but instead consider the role of online crowds and more complex social structures on different social media platforms. Future work might build upon our findings to design algorithms to automatically identify or predict whether a YT video will be moderated based on the engagement it receives on Twitter, as well as to detect early signals of radicalization. In addition, we aim to investigate whether our results generalize to other topics beyond political elections or other highly-moderated social media (e.g. Facebook, Instagram).
7 ACKNOWLEDGEMENTS
LL is partially supported by the Swiss National Science Foundation (grant CRSII5209250) via the SINERGIA project CARISMA (carisma-project.org/).
References
[1] Anton Abilov, Yiqing Hua, Hana Matatov, Ofra Amir, and Mor Naaman. 2021. Voter Fraud2020: a Multi-modal Dataset of Election Fraud Claims on Twitter. Proceedings of the International AAAI Conference on Web and Social Media 15, 1 (May 2021), 901–912. https://doi.org/10.1609/icwsm.v15i1.18113
[2] Adiya Abisheva, Venkata Rama Kiran Garimella, David Garcia, and Ingmar Weber. 2014. Who Watches (and Shares) What on Youtube? And When? Using Twitter to Understand Youtube Viewership. In Proceedings of the 7th ACM International Conference on Web Search and Data Mining (New York, New York, USA) (WSDM ’14). Association for Computing Machinery, New York, NY, USA, 593–602. https: //doi.org/10.1145/2556195.2566588
[3] Shiza Ali, Mohammad Hammas Saeed, Esraa Aldreabi, Jeremy Blackburn, Emiliano De Cristofaro, Savvas Zannettou, and Gianluca Stringhini. 2021. Understanding the Effect of Deplatforming on Social Networks. In 13th ACM Web Science Conference 2021 (Virtual Event, United Kingdom) (Web Sci ’21). Association for Computing Machinery, New York, NY, USA, 187–195. https: //doi.org/10.1145/3447535.3462637
[4] Cody Buntain, Richard Bonneau, Jonathan Nagler, and Joshua A. Tucker. 2021. You Tube Recommendations and Effects on Sharing Across Online Social Platforms. Proc. ACM Hum.-Comput. Interact. 5, CSCW1, Article 11 (apr 2021), 26 pages. https://doi.org/10.1145/3449085
[5] Emily Chen, Ashok Deb, and Emilio Ferrara. 2021. # Election2020: the first public Twitter dataset on the 2020 US Presidential election. Journal of Computational Social Science (2021), 1–18.
[6] Matthew Childs, Cody Buntain, Milo Z. Trujillo, and Benjamin D. Horne. 2022. Characterizing You Tube and Bit Chute Content and Mobilizers During U.S. Election Fraud Discussions on Twitter. In 14th ACM Web Science Conference 2022 (Barcelona, Spain) (Web Sci ’22). Association for Computing Machinery, New York, NY, USA, 250–259. https://doi.org/10.1145/3501247.3531571
[7] Matteo Cinelli, Walter Quattrociocchi, Alessandro Galeazzi, Carlo Valensise, Emanuele Brugnoli, Ana Schmidt, Paola Zola, Fabiana Zollo, and Antonio Scala. 2020. The COVID-19 social media infodemic. Scientific reports 10 (10 2020). https://doi.org/10.1038/s41598-020-73510-5
[8] Evelyn Douek. 2020. The rise of content cartels. Knight First Amendment Institute at Columbia (2020).
[9] Jacob Eisenstein, Amr Ahmed, and Eric P. Xing. 2011. Sparse Additive Generative Models of Text. In Proceedings of the 28th International Conference on International Conference on Machine Learning (Bellevue, Washington, USA) (ICML’11). Omnipress, Madison, WI, USA, 1041–1048.
[10] Fatima Ezzeddine, Luca Luceri, Omran Ayoub, Ihab Sbeity, Gianluca Nogara, Emilio Ferrara, and Silvia Giordano. 2023. Characterizing and Detecting State Sponsored Troll Activity on Social Media. ar Xiv:2210.08786 [cs.SI]
[11] Francesco Fabbri, Yanhao Wang, Francesco Bonchi, Carlos Castillo, and Michael Mathioudakis. 2022. Rewiring What-to-Watch-Next Recommendations to Reduce Radicalization Pathways. In Proceedings of the ACM Web Conference 2022 (Virtual Event, Lyon, France) (WWW ’22). Association for Computing Machinery, New York, NY, USA, 2719–2728. https://doi.org/10.1145/3485447.3512143
[12] Emilio Ferrara, Herbert Chang, Emily Chen, Goran Muric, and Jaimin Patel. 2020. Characterizing social media manipulation in the 2020 US presidential election. First Monday (2020).
[13] Tamar Ginossar, Iain J. Cruickshank, Elena Zheleva, Jason Sulskis, and Tanya Berger-Wolf. 2022. Cross-platform spread: vaccine-related content, sources, and conspiracy theories in You Tube videos shared in early Twitter COVID-19 conversations. Human Vaccines & Immunotherapeutics 18, 1 (2022), 1–13. https://doi.org/10.1080/21645515.2021.2003647 ar Xiv:https://doi.org/10.1080/21645515.2021.2003647 PMID: 35061560.
[14] Yevgeniy Golovchenko, Cody Buntain, Gregory Eady, Megan A. Brown, and Joshua A. Tucker. 2020. Cross-Platform State Propaganda: Russian Trolls on Twitter and You Tube during the 2016 U.S. Presidential Election. The International Journal of Press/Politics 25, 3 (2020), 357–389. https://doi.org/10.1177/ 1940161220912682 ar Xiv:https://doi.org/10.1177/1940161220912682
[15] Michael Hameleers, Thomas E. Powell, Toni G.L.A. Van Der Meer, and Lieke Bos. 2020. A Picture Paints a Thousand Lies? The Effects and Mechanisms of Multimodal Disinformation and Rebuttals Disseminated via Social Media. Political Communication 37, 2 (2020), 281–301. https://doi.org/10.1080/10584609.2019. 1674979
[16] Manoel Horta Ribeiro, Homa Hosseinmardi, Robert West, and Duncan J Watts. 2023. Deplatforming did not decrease Parler users’ activity on fringe social media. PNAS Nexus 2, 3 (03 2023). https://doi.org/ 10.1093/pnasnexus/pgad035 ar Xiv:https://academic.oup.com/pnasnexus/articlepdf/2/3/pgad035/49703177/pgad035.pdf pgad035.
[17] Maram Kurdi, Nuha Albadi, and Shivakant Mishra. 2020. “Video Unavailable”: Analysis and Prediction of Deleted and Moderated You Tube Videos. In 2020 IEEE/ACM International Conference on Advances in Social Networks Analysis and Mining (ASONAM). 166–173. https://doi.org/10.1109/ASONAM49781.2020. 9381310
[18] Valerio La Gatta, Chiyu Wei, Luca Luceri, Francesco Pierri, and Emilio Ferrara. 2023. Retrieving False Claims on Twitter during the Russia-Ukraine Conflict. In Companion Proceedings of the ACM Web Conference 2023 (Austin, TX, USA) (WWW ’23 Companion). Association for Computing Machinery, New York, NY, USA, 1317–1323. https://doi.org/10.1145/3543873.3587571
[19] Marcelo Sartori Locatelli, Josemar Caetano, Wagner Meira Jr., and Virgilio Almeida. 2022. Characterizing Vaccination Movements on You Tube in the United States and Brazil. In Proceedings of the 33rd ACM Conference on Hypertext and Social Media (Barcelona, Spain) (HT ’22). Association for Computing Machinery, New York, NY, USA, 80–90. https://doi.org/10.1145/3511095.3531283 — ACM HyperText copy
[20] Luca Luceri, Stefano Cresci, and Silvia Giordano. 2021. Social Media against Society. The Internet and the 2020 Campaign (2021).
[21] Luca Luceri, Silvia Giordano, and Emilio Ferrara. 2020. Detecting troll behavior via inverse reinforcement learning: A case study of russian trolls in the 2016 us election. In Proceedings of the international AAAI conference on web and social media, Vol. 14. 417–427.
[22] Tamar Mitts, Nilima Pisharody, and Jacob Shapiro. 2022. Removal of Anti-Vaccine Content Impacts Social Media Discourse. In 14th ACM Web Science Conference 2022 (Barcelona, Spain) (Web Sci ’22). Association for Computing Machinery, New York, NY, USA, 319–326. https://doi.org/10.1145/3501247.3531548
[23] Goran Muric, Yusong Wu, and Emilio Ferrara. 2021. COVID-19 vaccine hesitancy on social media: building a public Twitter data set of antivaccine content, vaccine
misinformation, and conspiracies. JMIR public health and surveillance 7, 11 (2021), e30642.
[24] Gianluca Nogara, Padinjaredath Suresh Vishnuprasad, Felipe Cardoso, Omran Ayoub, Silvia Giordano, and Luca Luceri. 2022. The Disinformation Dozen: An Exploratory Analysis of Covid-19 Disinformation Proliferation on Twitter. In 14th ACM Web Science Conference 2022 (Barcelona, Spain) (Web Sci ’22). Association for Computing Machinery, New York, NY, USA, 348–358. https://doi.org/10.1145/ 3501247.3531573
[25] Francesco Pierri, Matthew R De Verna, Kai-Cheng Yang, David Axelrod, John Bryden, and Filippo Menczer. 2023. One Year of COVID-19 Vaccine Misinformation on Twitter: Longitudinal Study. Journal of Medical Internet Research 25 (2023), e42227.
[26] Francesco Pierri, Luca Luceri, and Emilio Ferrara. 2022. How Does Twitter Account Moderation Work? Dynamics of Account Creation and Suspension During Major Geopolitical Events. ar Xiv:2209.07614 [cs.SI]
[27] Francesco Pierri, Luca Luceri, Nikhil Jindal, and Emilio Ferrara. 2023. Propaganda and Misinformation on Facebook and Twitter during the Russian Invasion of Ukraine. In Proceedings of the 15th ACM Web Science Conference 2023 (Austin, TX, USA) (Web Sci ’23). Association for Computing Machinery, New York, NY, USA, 65–74. https://doi.org/10.1145/3578503.3583597
[28] Manoel Horta Ribeiro, Raphael Ottoni, Robert West, Virgílio A. F. Almeida, and Wagner Meira. 2020. Auditing Radicalization Pathways on You Tube. In Proceedings of the 2020 Conference on Fairness, Accountability, and Transparency (Barcelona, Spain) (FAT ’20). Association for Computing Machinery, New York, NY, USA, 131–141. https://doi.org/10.1145/3351095.3372879
[29] Giuseppe Russo, Luca Verginer, Manoel Horta Ribeiro, and Giona Casiraghi. 2023. Spillover of Antisocial Behavior from Fringe Platforms: The Unintended Consequences of Community Banning. Proceedings of the International AAAI Conference on Web and Social Media 17, 1 (Jun. 2023), 742–753. https://doi.org/ 10.1609/icwsm.v17i1.22184
[30] Zeve Sanderson, Megan A Brown, Richard Bonneau, Jonathan Nagler, and Joshua A Tucker. 2021. Twitter flagged Donald Trump’s tweets with election misinformation: They continued to spread both on and off the platform. Harvard Kennedy School Misinformation Review (2021).
[31] Digital Forensic Research Lab Stanford Internet Observatory, Center for an Informed Public. 2021. The Long Fuse: Misinformation and the 2020 Election. Stanford Digital Repository: Election Integrity.
[32] Vishnuprasad Padinjaredath Suresh, Gianluca Nogara, Felipe Cardoso, Stefano Cresci, Silvia Giordano, and Luca Luceri. 2024. Tracking Fringe and Coordinated Activity on Twitter Leading Up To the US Capitol Attack. Proceedings of the International AAAI Conference on Web and Social Media (2024).
[33] Yuping Wang, Savvas Zannettou, Jeremy Blackburn, Barry Bradlyn, Emiliano De Cristofaro, and Gianluca Stringhini. 2021. A Multi-Platform Analysis of Political News Discussion and Sharing on Web Communities. In 2021 IEEE International Conference on Big Data (Big Data). 1481–1492. https://doi.org/10.1109/ Big Data52589.2021.9671843
[34] Tom Wilson and Kate Starbird. 2020. Cross-platform disinformation campaigns: lessons learned and next steps. Harvard Kennedy School Misinformation Review 1, 1 (2020).
[35] Yiping Xia, Josephine Lukito, Yini Zhang, Chris Wells, Sang Jung Kim, and Chau Tong. 2019. Disinformation, performed: self-presentation of a Russian IRA account on Twitter. Information, Communication & Society 22, 11 (2019), 1646–1664. https://doi.org/10.1080/1369118X.2019.1621921 ar Xiv:https://doi.org/10.1080/1369118X.2019.1621921
[36] Kai-Cheng Yang, Emilio Ferrara, and Filippo Menczer. 2022. Botometer 101: Social bot practicum for computational social scientists. Journal of Computational Social Science 5, 2 (2022), 1511–1528.
Do you like what you are reading? Subscribe to receive updates.
Unsubscribe anytime