
Source and attribution. Faithful full-text import from ACM Hypertext and Social Media 2021. Source PDF:
3465336.3475113.pdf; DOI: 10.1145/3465336.3475113. Published with ACM authorization recorded inACM-AUTHORIZATION.md.
Complete visual and table regions
Pushkal Agarwal King’s College London pushkal.agarwal@kcl.ac.uk
Oliver Hawkins House of Commons hawkinso@parliament.uk
Noel Dempsey House of Commons dempseyn@parliament.uk
Nishanth Sastry University of Surrey n.sastry@surrey.ac.uk
Abstract
Online presence is becoming unavoidable for politicians worldwide. In countries such as the UK, Twitter has become the platform of choice, with over 85% (553 of 650) of the Members of Parliament (MPs) having an active online presence. Whereas this has allowed ordinary citizens unprecedented and immediate access to their elected representatives, it has also led to serious concerns about online hate towards MPs. This work attempts to shed light on the problem using a dataset of conversations between MPs and nonMPs over a two month period. Deviating from other approaches in the literature, our data captures entire threads of conversations between Twitter handles of MPs and citizens in order to provide a full context for content that may be flagged as ‘hate’. By combining widely-used hate speech detection tools trained on several widely available datasets, we analyse 2.5 million tweets to identify hate speech against MPs and we characterise hate across multiple dimensions of time, topics and MPs’ demographics. We find that MPs are subject to intense ‘pile on’ hate by citizens whereby they get more hate when they are already busy with a high volume of mentions regarding some event or situation. We also show that hate is more dense with regard to certain topics and that MPs who have an ethnic minority background and those holding positions in Government receive more hate than other MPs. We find evidence of citizens expressing negative sentiments while engaging in crossparty conversations, with supporters of one party (e.g. Labour) directing hate against MPs of another party (e.g. Conservative).
Ccs Concepts
• Computing methodologies →Information extraction; Topic modeling; • Human-centered computing →User models; • Social and professional topics →Hate speech.
Keywords
twitter; politics; hate-speech; topics
ACM acknowledges that this contribution was authored or co-authored by an employee, contractor or affiliate of a national government. As such, the Government retains a nonexclusive, royalty-free right to publish or reproduce this article, or to allow others to do so, for Government purposes only. HT ’21, August 30-September 2, 2021, Virtual Event, Ireland © 2021 Association for Computing Machinery. ACM ISBN 978-1-4503-8551-0/21/08...$15.00 https://doi.org/10.1145/3465336.3475113
Margarita Amaxopoulou King’s College London margarita.amaxopoulou@kcl.ac.uk
Edward Wood House of Commons woode@parliament.uk
1. Introduction
In recent years, online presence has become an essential component of modern democracies [19, 24, 26, 28, 36]. In the UK for example, 553 out of 650 Members of Parliament (MPs) use Twitter for their outreach and citizen-engagement activities [3]. More and more elected representatives choose to maintain an active profile on social media platforms, which renders them directly reachable by the broader public on an unprecedented scale. Although this increasing digital reach is bringing more people into politics [56], increasing online activity in the political and other spheres has led to concerns about online hate. Evidence suggests that online hate is a grave and growing problem. Not only does it cause short-term frustration, anger or fear to its direct and indirect addressees, but it may also have long term implications for victims’ mental health or marginalise them and dissuade them from actively participating in public discourse [59]. The stakes may be even higher when hate victims are MPs. There are increasing concerns that “left unchecked, abuse and intimidation will change our democracy and mean that the way Members interact with constituents will need to change” [40]. There are numerous instances of MPs being targeted with hateful and offensive speech [21, 22, 53]. Several female MPs cited this as a reason they stood down before the 2019 General Election [51]. It has therefore become imperative to understand and address the prevalence of online hate in the online discourse between MPs and citizens. To shed light on this important issue, we create and curate a dataset of hate speech in the public discourse between citizens and MPs on Twitter over a two month period. Our dataset contains 2.5 Million tweets from 293k users as well as 553 MPs, who have 4.3 Million followers collectively. Unlike most previous efforts [3, 21], our data captures entire threads of conversation between Twitter handles of MPs and citizens in order to provide full context for content that may be flagged as ‘hate’. We additionally annotate this basic dataset in several ways. First, we annotate details of the MPs with their party information, demographics (ethnicity and gender) and also the constituency/geographic region that they represent. Using publicly available information on the Twitter handles and
biographies of citizens that tweet at the MPs, we similarly obtain, where possible, gender, ethnicity and geographic information (down to constituency level) of the users engaging the MPs in conversation. Second, we identify a high level list of commonly prevalent topics in the MP-citizen conversations based on a comprehensive study of the top 1,000 hashtags (60% of all the hashtags used). Third, we create and run 18 variants of state-of-the-art hate speech classifiers on the content, identifying and labelling hateful content by taking a majority vote amongst all classifiers. We have made our dataset, annotations and labels available for non-commercial research usage at http://tiny.cc/hate-towards-mps. Using this dataset, we examine the prevalence of hate speech in the nationally important discourse between citizens and elected representatives. As expected, there is very little hate in utterances by MPs and most of the hate speech is directed at the MPs by nonMPs. We identify a “pile on” effect, whereby MPs receive more hate during busy periods for them, when they are already receiving a huge volume of tweets. In many cases, this is because MPs receive more attention when they are caught amidst a controversy, which then leads on to more hate speech directed at them. We find that when tweets containing hate have hashtags, they tend to be easily identified by the use of rhetorical hashtags such as #justsaying, #shameful and #fakenews. We then ask whether certain kinds of MPs are targeted more than others. We find evidence that MPs from ethnic minority backgrounds receive more hate than MPs from white backgrounds. Interestingly, despite well documented cases of misogyny [12, 25], we find that male and female MPs are targeted equally by hate speech. However, we find that MPs from the governing Conservative Party, especially those with a position in Government (e.g., as a Cabinet minister) receive more hate than other MPs. We also find that hate comes from across the party lines, with supporters of one party attacking MPs from other parties. Our findings have important implications from a legal and policy perspective. They provide evidence-based support for the UK Law Commission’s proposals for law reform to capture coordinated and non-coordinated “pile on” harassment [6]. The fact that MPs having an ethnic minority background receive more hate on social media platforms should be taken into serious consideration by policymakers. Further, with regard to the recent EU Commission proposal to regulate content moderation, our work provides an example of the kind of measurements that can be used as an element of socialmedia platforms’ annual reports, should the latter become part of the forthcoming Digital Services Act [5]. This work is a small step in combating the problem of hate speech in the national discourse, which many researchers see as a potential threat to our social order, threatening social peace and cohesion [63].
2. Related Work
Online engagement by politicians in the UK is covered in various studies. Early studies by [23, 27, 32] indicate the initial use of Twitter by MPs. Since then there has been a ten fold increase in the use of Twitter and now nearly 90% of UK MPs have a Twitter presence [3, 22]. The initial use of Twitter was broadcasting and outreach during election periods [23, 28, 31, 33]. Later studies have shown its further use as a tool for political engagement and participation within the
constituency or the party as well as for facilitation of cross-party interactions [2, 3, 36]. However, the increase in use of social media platforms for political engagement has not only brought opportunities but also serious barriers to an open and deliberative public discourse. Studies have shown that politicians face online abuse and are subject to intense verbal attacks online [21, 22, 25, 51]. Corroborating our results, a study based on a manual annotation of 3000 tweets finds that male and female MPs both receive similar amounts of hate [61]. However, their qualitative methodology finds that the hate received by female MPs is more threatening. Gorell [21] finds that MPs who stood down at the 2019 UK General Election received more abuse than the ones who stood for election again. This paper focuses on hate speech on Twitter towards UK MPs, but hate directed at politicians is not limited to just one country or one social media platform. Studies across the globe have identified various forms of hate in multiple countries: hate speech and ethnic politics play a role in Nigeria [15], misogyny to female politicians is an issue in Japan [17] etc. [14] shows that misogyny exists on Youtube in the form of hateful comments as well as hateful videos about UK Politicians. Closed platforms like WhatsApp can also have significant toxic conversation about politicians [1, 50]. This paper mainly focuses on hate speech towards politicians and we find very little hate speech by UK politicians during the period we study. A few studies have examined hate speech by politicians and the chilling effect this has had in other contexts, such as hate speech by politicians against Muslims [46]. Rekker [49] studied Geert Wilders’ prosecution in the Netherlands and argued that his conviction eventually undermined democracy. [58] shows that Wilders’ party’s popularity increased as a result of the prosecution. This suggests that prosecuting or punishing politicians for hate speech can end up being counter-productive. Unfortunately hate speech by politicians can be extremely effective in changing public opinion, polarizing the electorate and increasing domestic terrorism [47]. In spite of the challenges, research efforts are being made in the UK and other parts of the world to tackle the issue of online hate at scale [10, 20, 52]. Other efforts have helped further research by collecting and sharing datasets of hate speech in various contexts [8, 9, 16, 29, 35, 48, 57, 62, 64, 65]. Further, detailed accounts of hate speech literature [55] and systematic review of hate speech evolutution across different disciplines have been created [42]. While platforms themselves have been taking steps to conduct content moderation effectively, factors such as the lack of common definitions of ‘illegal content’ and the fragmentation of hate speech laws pose barriers to such efforts [54]. In this light, researchers have been emphasising the importance of solving definitional conundrums and providing clear hate speech typologies and guidelines [59]. Others have been providing ‘quantitative insights into what interventions might be most effective in combating’ hate speech in online platforms [45]. Empirical studies-based policy recommendations include the creation of a harmonised ‘notice and action’ framework across platforms to ensure that they avoid over or underremoval of content and that the right balance is struck between fundamental human rights [11]. While many computational research efforts rely solely on processes of quantification, policy researchers and the legal discipline
have been taking a more qualitative approach in conceiving the constitutive elements of ‘hate speech’ or the consequences of it. ‘Hate speech’ as a notion has traditionally been constructed within legal research [42]. Famously, Waldron has argued in his seminal book, ‘The harm in hate speech’ [60], that the phenomenon needs to be regulated not because of how victims feel but because it constitutes an attack on social groups’ dignity, hindering them to freely and safely participating in the public discourse. Whether and how particular forms of speech undermine a group’s dignity largely relies on assessment relating to the legal arguments and contextspecific deliberative processes such as judicial hearings, rather than a purely machine learning-based approach. Legal scholars have argued that legal protection depends upon ‘the discursive context’ and quite notably that in political discourse more space is to be given to freedom of expression [13]. Our manual annotations take these aspects into consideration.
3. BACKGROUND AND DATASET 3.1 UK Parliament during the period studied in our dataset
The UK Parliament has two legislative chambers: the House of Commons and the House of Lords. The House of Commons has an elected membership and by constitutional convention it has primacy over the House of Lords, whose members are not directly elected by the public. A government is typically formed by the political party with the largest number of members of the House of Commons, who are known as ‘Members of Parliament’ or ‘MPs’. Members of Parliament are elected at national general elections, which under the Fixed-term Parliaments Act 2011 must be held at least once every five years. Since 2010 there have been 650 MPs in the House of Commons, representing 533 constituencies in England, 59 in Scotland, 40 in Wales, and 18 in Northern Ireland. The dataset used for the analysis in this paper consists of 2.5 Million tweets covering the period from 1 October 2017 to 29 November 2017. A number of considerations led to this particular period as a choice. Since we wanted to understand online hate, we focused on a period during which the EU Withdrawal and Implementation Bill was introduced (13 Nov 2017), as this was a key piece of legislation on Brexit during a highly fractious period in British politics. This period also coincided with the blow up of the #MeToo movement in Westminster, leading to a number of high profile resignations. We also wanted a time period that was far enough in the past so that it did not cloud annotator judgement yet is close enough that there was sufficient online activity by MPs and citizens, including evidence of online hate. So as not to influence or be influenced by current politics, we wished to choose a time period before the current premiership of Boris Johnson. We also chose a period that included days when Parliament was in session as well as in recess. There were other events and scandals that happened within this period (e.g. the resignation of Priti Patel as International Development Secretary), making this a suitable period for the study of online hate. During the period chosen, no party held an overall majority of seats in the House of Commons. The Conservative Party was the largest party with 317 seats, followed by the Labour Party (262), the Scottish National Party (35), the Liberal Democrats (12), the
Democratic Unionist Party (10), Sinn Féin (7), Plaid Cymru (4), and the Green Party (1). The remaining two seats were held by Lady Sylvia Hermon, an independent MP in Northern Ireland, and the House of Commons Speaker, John Bercow (by convention the Speaker severs all party ties during their time in office). Following a general general election held on 8 June 2017, the Conservative Party formed a minority government, relying on the support of the Democratic Unionist Party to achieve a governing majority through a ‘confidence and supply’ agreement. Of the 650 MPs sitting in Parliament during the period of analysis we identified 553 who were on Twitter. The distribution of MPs by party was: Conservative (244), Labour (240), Scottish National Party (35), Liberal Democrat (12), Democratic Unionist Party (9), Sinn Féin (7), Plaid Cymru (4), Green Party (1), Independent (1).
3.2. Augmenting the dataset
As mentioned previously, the data consists of entire threads of conversations between MPs and non-MP users who mention them. In total, during the period of study, there were 2.5 Million tweets (across 1.25 Million threads), from 293k users and 553 MPs with 4.3 Million followers collectively. We augmented the raw dataset crawled from Twitter by associating each tweet with data from two additional sources: data on the characteristics of the MPs associated with each tweet, and labels identifying the topical content of tweets based on their hashtags. Data on the characteristics of MPs was added to the dataset by linking the Twitter usernames of MPs to records in official and semi-official sources. Data on the topical content of tweets was produced by developing a topic taxonomy for the most frequently used hashtags in the dataset, and associating terms in the taxonomy with tweets using those hashtags.
3.2.1 Characteristics of MPs. Every tweet in the dataset is associated with an individual MP, who was either the author or the recipient of that tweet. We first augment our dataset by fetching details about these MPs. Parliament publishes data on MPs in a suite of online APIs. These APIs were developed principally to make data from Parliament’s administrative systems available to its website, but the endpoints are open to the general public and can be used to compile datasets on the characteristics of MPs and their work in Parliament. Data on the characteristics of MPs can be downloaded from the Members Names’ Information Service (MNIS) [37]. This is one of several public APIs maintained by the UK Parliament that records the work of Members. The data held in MNIS is administrative data, so it can potentially contain errors. But as this data is actively managed by Parliamentary staff, it is arguably the most reliable and up-to-date source of data on MP characteristics. Data was downloaded from MNIS on all MPs serving in the House of Commons during the period of analysis. This was first used to associate each MP in the tweets dataset with their unique identifier in MNIS. MPs in the tweets dataset whose Twitter usernames were either not held in MNIS, or who had changed their usernames since the period when the data was collected, were manually verified and their MNIS ids recorded. After this initial linking exercise there were 2.5 Million tweets associated with 553 MPs: 2.3 Million are tweets or replies from citizens addressed to MPs and 176K are tweets or replies from MPs.
Data on the characteristics of these 553 MPs was then added to each row in the tweets dataset. MNIS contains data on each Member’s name, gender, constituency, political party, and on any government or opposition roles they have held — these are ministerial positions in the government, or equivalent roles in opposition parties’ front bench teams. This data was added to the dataset, with Boolean indicators used to show whether an MP held a government or opposition role.1
One characteristic of interest that is not held in MNIS is an MP’s ethnic group. Parliament holds no official record of MPs’ selfdefined ethnicity, but MPs themselves have identified a potential association between their ethnicity and the levels of abuse they experience online [38], so this is important to capture. The think tank British Future compiles some data on the ethnicity of MPs in order to assess the extent to which the ethnic composition of the House of Commons reflects the society it seeks to represent. Following each general election, British Future publishes a list of MPs they believe to be members of ethnic minority groups. British Future has said that in compiling these lists they “follow a liberal principle of self-definition, so that where candidates define themselves as being from ethnic minority or mixed heritage backgrounds in their own public statements, they have been included in these figures” [30]. British Future’s list of ethnic minority MPs elected at the 2017 General Election was used to add a Boolean indicator of the ethnic minority status of each MP to the dataset [18].
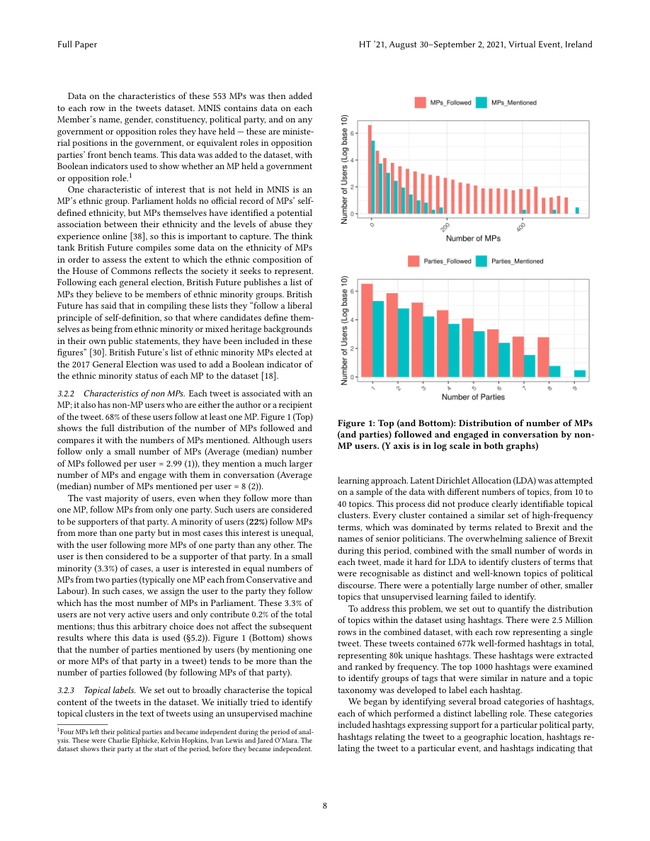
3.2.2 Characteristics of non MPs. Each tweet is associated with an MP; it also has non-MP users who are either the author or a recipient of the tweet. 68% of these users follow at least one MP. Figure 1 (Top) shows the full distribution of the number of MPs followed and compares it with the numbers of MPs mentioned. Although users follow only a small number of MPs (Average (median) number of MPs followed per user = 2.99 (1)), they mention a much larger number of MPs and engage with them in conversation (Average (median) number of MPs mentioned per user = 8 (2)). The vast majority of users, even when they follow more than one MP, follow MPs from only one party. Such users are considered to be supporters of that party. A minority of users (22%) follow MPs from more than one party but in most cases this interest is unequal, with the user following more MPs of one party than any other. The user is then considered to be a supporter of that party. In a small minority (3.3%) of cases, a user is interested in equal numbers of MPs from two parties (typically one MP each from Conservative and Labour). In such cases, we assign the user to the party they follow which has the most number of MPs in Parliament. These 3.3% of users are not very active users and only contribute 0.2% of the total mentions; thus this arbitrary choice does not affect the subsequent results where this data is used (§5.2)). Figure 1 (Bottom) shows that the number of parties mentioned by users (by mentioning one or more MPs of that party in a tweet) tends to be more than the number of parties followed (by following MPs of that party).
3.2.3 Topical labels. We set out to broadly characterise the topical content of the tweets in the dataset. We initially tried to identify topical clusters in the text of tweets using an unsupervised machine
1Four MPs left their political parties and became independent during the period of analysis. These were Charlie Elphicke, Kelvin Hopkins, Ivan Lewis and Jared O’Mara. The dataset shows their party at the start of the period, before they became independent.
Figure 1: Top (and Bottom): Distribution of number of MPs (and parties) followed and engaged in conversation by nonMP users. (Y axis is in log scale in both graphs)
learning approach. Latent Dirichlet Allocation (LDA) was attempted on a sample of the data with different numbers of topics, from 10 to 40 topics. This process did not produce clearly identifiable topical clusters. Every cluster contained a similar set of high-frequency terms, which was dominated by terms related to Brexit and the names of senior politicians. The overwhelming salience of Brexit during this period, combined with the small number of words in each tweet, made it hard for LDA to identify clusters of terms that were recognisable as distinct and well-known topics of political discourse. There were a potentially large number of other, smaller topics that unsupervised learning failed to identify. To address this problem, we set out to quantify the distribution of topics within the dataset using hashtags. There were 2.5 Million rows in the combined dataset, with each row representing a single tweet. These tweets contained 677k well-formed hashtags in total, representing 80k unique hashtags. These hashtags were extracted and ranked by frequency. The top 1000 hashtags were examined to identify groups of tags that were similar in nature and a topic taxonomy was developed to label each hashtag. We began by identifying several broad categories of hashtags, each of which performed a distinct labelling role. These categories included hashtags expressing support for a particular political party, hashtags relating the tweet to a geographic location, hashtags relating the tweet to a particular event, and hashtags indicating that
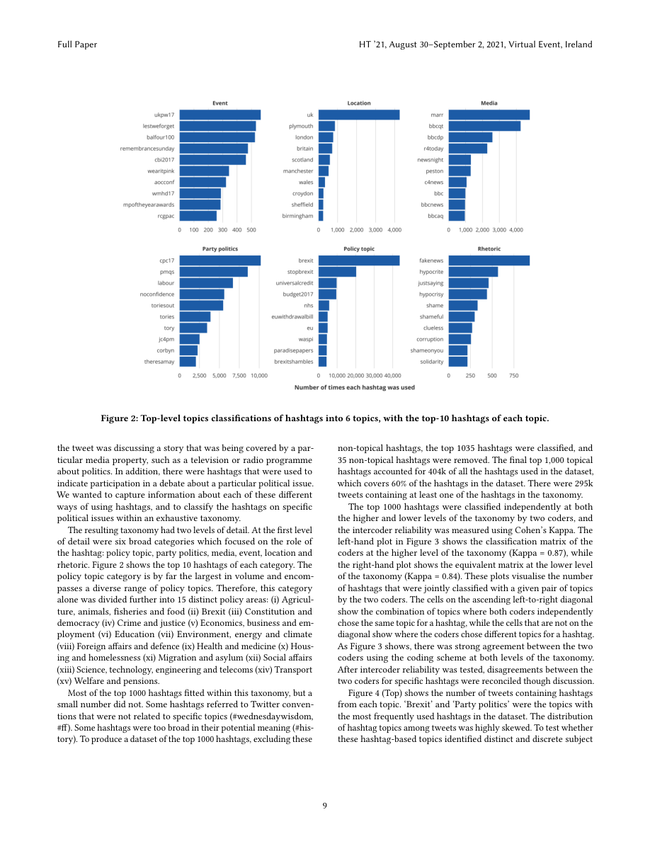
Figure 2: Top-level topics classifications of hashtags into 6 topics, with the top-10 hashtags of each topic.
the tweet was discussing a story that was being covered by a particular media property, such as a television or radio programme about politics. In addition, there were hashtags that were used to indicate participation in a debate about a particular political issue. We wanted to capture information about each of these different ways of using hashtags, and to classify the hashtags on specific political issues within an exhaustive taxonomy. The resulting taxonomy had two levels of detail. At the first level of detail were six broad categories which focused on the role of the hashtag: policy topic, party politics, media, event, location and rhetoric. Figure 2 shows the top 10 hashtags of each category. The policy topic category is by far the largest in volume and encompasses a diverse range of policy topics. Therefore, this category alone was divided further into 15 distinct policy areas: (i) Agriculture, animals, fisheries and food (ii) Brexit (iii) Constitution and democracy (iv) Crime and justice (v) Economics, business and employment (vi) Education (vii) Environment, energy and climate (viii) Foreign affairs and defence (ix) Health and medicine (x) Housing and homelessness (xi) Migration and asylum (xii) Social affairs (xiii) Science, technology, engineering and telecoms (xiv) Transport (xv) Welfare and pensions. Most of the top 1000 hashtags fitted within this taxonomy, but a small number did not. Some hashtags referred to Twitter conventions that were not related to specific topics (#wednesdaywisdom, #ff). Some hashtags were too broad in their potential meaning (#history). To produce a dataset of the top 1000 hashtags, excluding these
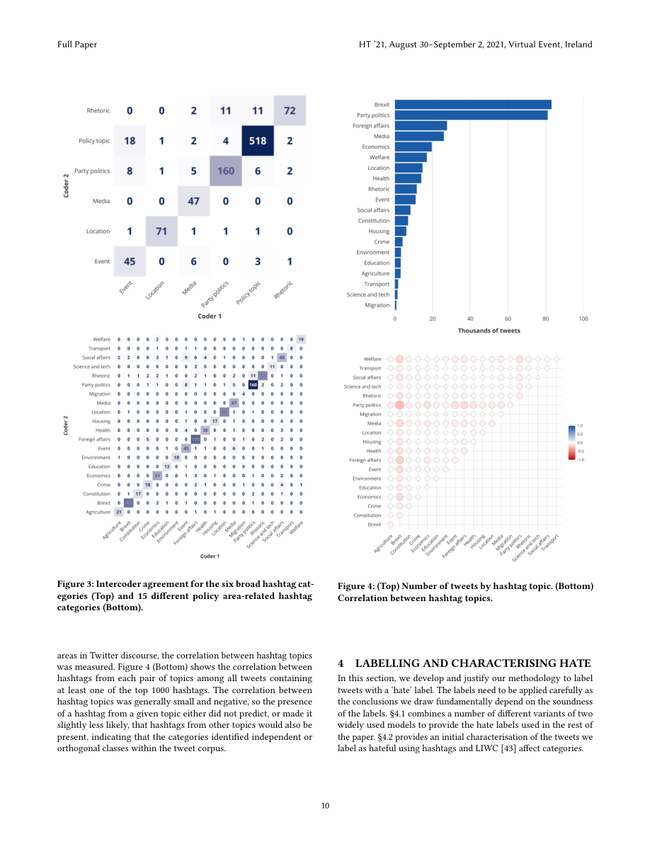
non-topical hashtags, the top 1035 hashtags were classified, and 35 non-topical hashtags were removed. The final top 1,000 topical hashtags accounted for 404k of all the hashtags used in the dataset, which covers 60% of the hashtags in the dataset. There were 295k tweets containing at least one of the hashtags in the taxonomy. The top 1000 hashtags were classified independently at both the higher and lower levels of the taxonomy by two coders, and the intercoder reliability was measured using Cohen’s Kappa. The left-hand plot in Figure 3 shows the classification matrix of the coders at the higher level of the taxonomy (Kappa = 0.87), while the right-hand plot shows the equivalent matrix at the lower level of the taxonomy (Kappa = 0.84). These plots visualise the number of hashtags that were jointly classified with a given pair of topics by the two coders. The cells on the ascending left-to-right diagonal show the combination of topics where both coders independently chose the same topic for a hashtag, while the cells that are not on the diagonal show where the coders chose different topics for a hashtag. As Figure 3 shows, there was strong agreement between the two coders using the coding scheme at both levels of the taxonomy. After intercoder reliability was tested, disagreements between the two coders for specific hashtags were reconciled though discussion. Figure 4 (Top) shows the number of tweets containing hashtags from each topic. ‘Brexit’ and ‘Party politics’ were the topics with the most frequently used hashtags in the dataset. The distribution of hashtag topics among tweets was highly skewed. To test whether these hashtag-based topics identified distinct and discrete subject
Figure 3: Intercoder agreement for the six broad hashtag categories (Top) and 15 different policy area-related hashtag categories (Bottom).
areas in Twitter discourse, the correlation between hashtag topics was measured. Figure 4 (Bottom) shows the correlation between hashtags from each pair of topics among all tweets containing at least one of the top 1000 hashtags. The correlation between hashtag topics was generally small and negative, so the presence of a hashtag from a given topic either did not predict, or made it slightly less likely, that hashtags from other topics would also be present, indicating that the categories identified independent or orthogonal classes within the tweet corpus.
10
Figure 4: (Top) Number of tweets by hashtag topic. (Bottom) Correlation between hashtag topics.
4. Labelling And Characterising Hate
In this section, we develop and justify our methodology to label tweets with a ‘hate’ label. The labels need to be applied carefully as the conclusions we draw fundamentally depend on the soundness of the labels. §4.1 combines a number of different variants of two widely used models to provide the hate labels used in the rest of the paper. §4.2 provides an initial characterisation of the tweets we label as hateful using hashtags and LIWC [43] affect categories.
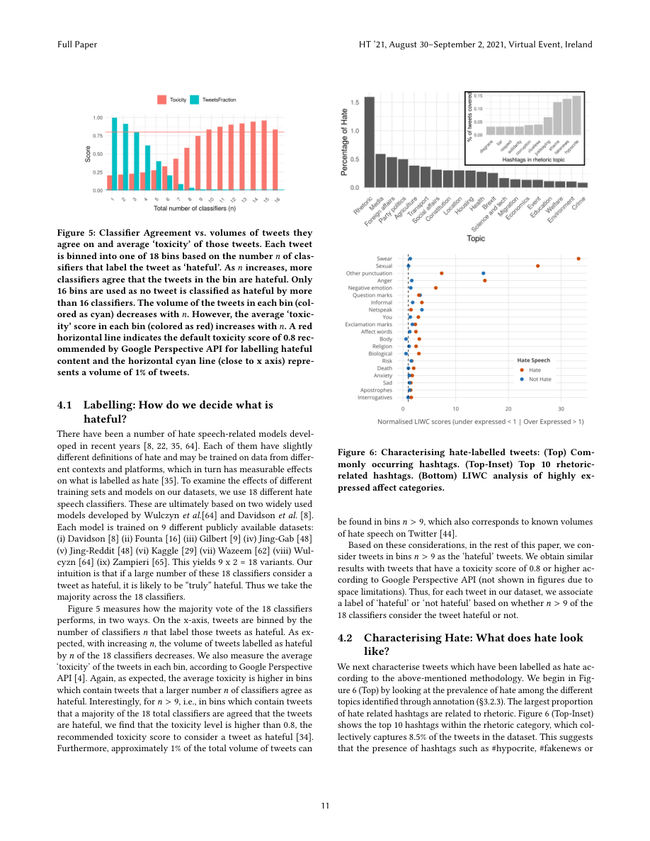
Figure 5: Classifier Agreement vs. volumes of tweets they agree on and average ‘toxicity’ of those tweets. Each tweet is binned into one of 18 bins based on the number 𝑛of classifiers that label the tweet as ‘hateful’. As 𝑛increases, more classifiers agree that the tweets in the bin are hateful. Only 16 bins are used as no tweet is classified as hateful by more than 16 classifiers. The volume of the tweets in each bin (colored as cyan) decreases with 𝑛. However, the average ‘toxicity’ score in each bin (colored as red) increases with 𝑛. A red horizontal line indicates the default toxicity score of 0.8 recommended by Google Perspective API for labelling hateful content and the horizontal cyan line (close to x axis) represents a volume of 1% of tweets.
4.1. Labelling: How do we decide what is hateful?
There have been a number of hate speech-related models developed in recent years [8, 22, 35, 64]. Each of them have slightly different definitions of hate and may be trained on data from different contexts and platforms, which in turn has measurable effects on what is labelled as hate [35]. To examine the effects of different training sets and models on our datasets, we use 18 different hate speech classifiers. These are ultimately based on two widely used models developed by Wulczyn et al.[64] and Davidson et al. [8]. Each model is trained on 9 different publicly available datasets: (i) Davidson [8] (ii) Founta [16] (iii) Gilbert [9] (iv) Jing-Gab [48] (v) Jing-Reddit [48] (vi) Kaggle [29] (vii) Wazeem [62] (viii) Wulcyzn [64] (ix) Zampieri [65]. This yields 9 x 2 = 18 variants. Our intuition is that if a large number of these 18 classifiers consider a tweet as hateful, it is likely to be “truly” hateful. Thus we take the majority across the 18 classifiers. Figure 5 measures how the majority vote of the 18 classifiers performs, in two ways. On the x-axis, tweets are binned by the number of classifiers 𝑛that label those tweets as hateful. As expected, with increasing 𝑛, the volume of tweets labelled as hateful by 𝑛of the 18 classifiers decreases. We also measure the average ‘toxicity’ of the tweets in each bin, according to Google Perspective API [4]. Again, as expected, the average toxicity is higher in bins which contain tweets that a larger number 𝑛of classifiers agree as hateful. Interestingly, for 𝑛> 9, i.e., in bins which contain tweets that a majority of the 18 total classifiers are agreed that the tweets are hateful, we find that the toxicity level is higher than 0.8, the recommended toxicity score to consider a tweet as hateful [34]. Furthermore, approximately 1% of the total volume of tweets can
11
Figure 6: Characterising hate-labelled tweets: (Top) Commonly occurring hashtags. (Top-Inset) Top 10 rhetoricrelated hashtags. (Bottom) LIWC analysis of highly expressed affect categories.
be found in bins 𝑛> 9, which also corresponds to known volumes of hate speech on Twitter [44]. Based on these considerations, in the rest of this paper, we consider tweets in bins 𝑛> 9 as the ‘hateful’ tweets. We obtain similar results with tweets that have a toxicity score of 0.8 or higher according to Google Perspective API (not shown in figures due to space limitations). Thus, for each tweet in our dataset, we associate a label of ‘hateful’ or ‘not hateful’ based on whether 𝑛> 9 of the 18 classifiers consider the tweet hateful or not.
4.2. Characterising Hate: What does hate look like?
We next characterise tweets which have been labelled as hate according to the above-mentioned methodology. We begin in Figure 6 (Top) by looking at the prevalence of hate among the different topics identified through annotation (§3.2.3). The largest proportion of hate related hashtags are related to rhetoric. Figure 6 (Top-Inset) shows the top 10 hashtags within the rhetoric category, which collectively captures 8.5% of the tweets in the dataset. This suggests that the presence of hashtags such as #hypocrite, #fakenews or
#justsaying can be a strong indicator of a hate label from a more sophisticated ML model. Indeed, the presence of one or more of the 75 rhetoric-related hashtags makes it 6 times more likely that the tweet is labelled as hate by our majority voting model (§4.1). We next examine the different kinds of affect invoked by the vocabulary used in the hate labelled tweets. We use Linguistic Inquiry and Word Count (LIWC) [43], a tool which has been carefully calibrated based on a wide variety of linguistic contexts. Figure 6 (Bottom) shows the top 20 over expressed LIWC affect categories for hate-labelled tweets. Swear words, sexual words, negative emotions and anger-related words are found more than 15-30 times the amount that may be expected in ‘normal’ language (where normal is as calibrated by the mean of LIWC 2015 study2). Non-hate tweets had marginal over expression of swear words, negative emotions and anger-related words, but not sexual words.
4.3. Characterising Hate: Who receives hate and when?
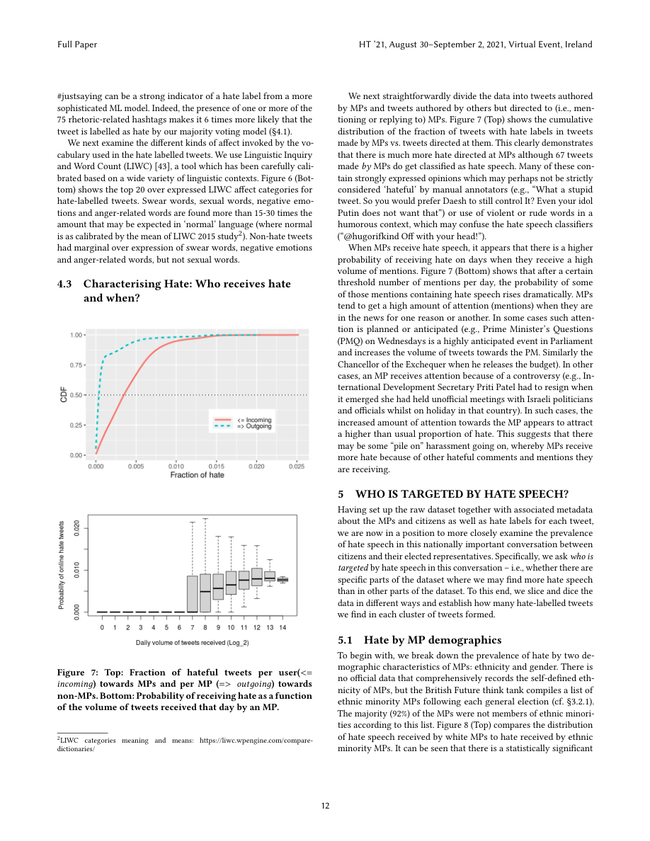
Figure 7: Top: Fraction of hateful tweets per user(<= 𝑖𝑛𝑐𝑜𝑚𝑖𝑛𝑔) towards MPs and per MP (=> 𝑜𝑢𝑡𝑔𝑜𝑖𝑛𝑔) towards non-MPs. Bottom: Probability of receiving hate as a function of the volume of tweets received that day by an MP.
2LIWC categories meaning and means: https://liwc.wpengine.com/comparedictionaries/
12
We next straightforwardly divide the data into tweets authored by MPs and tweets authored by others but directed to (i.e., mentioning or replying to) MPs. Figure 7 (Top) shows the cumulative distribution of the fraction of tweets with hate labels in tweets made by MPs vs. tweets directed at them. This clearly demonstrates that there is much more hate directed at MPs although 67 tweets made by MPs do get classified as hate speech. Many of these contain strongly expressed opinions which may perhaps not be strictly considered ‘hateful’ by manual annotators (e.g., “What a stupid tweet. So you would prefer Daesh to still control It? Even your idol Putin does not want that”) or use of violent or rude words in a humorous context, which may confuse the hate speech classifiers (“@hugorifkind Off with your head!”). When MPs receive hate speech, it appears that there is a higher probability of receiving hate on days when they receive a high volume of mentions. Figure 7 (Bottom) shows that after a certain threshold number of mentions per day, the probability of some of those mentions containing hate speech rises dramatically. MPs tend to get a high amount of attention (mentions) when they are in the news for one reason or another. In some cases such attention is planned or anticipated (e.g., Prime Minister’s Questions (PMQ) on Wednesdays is a highly anticipated event in Parliament and increases the volume of tweets towards the PM. Similarly the Chancellor of the Exchequer when he releases the budget). In other cases, an MP receives attention because of a controversy (e.g., International Development Secretary Priti Patel had to resign when it emerged she had held unofficial meetings with Israeli politicians and officials whilst on holiday in that country). In such cases, the increased amount of attention towards the MP appears to attract a higher than usual proportion of hate. This suggests that there may be some “pile on” harassment going on, whereby MPs receive more hate because of other hateful comments and mentions they are receiving.
5. Who Is Targeted By Hate Speech?
Having set up the raw dataset together with associated metadata about the MPs and citizens as well as hate labels for each tweet, we are now in a position to more closely examine the prevalence of hate speech in this nationally important conversation between citizens and their elected representatives. Specifically, we ask who is targeted by hate speech in this conversation – i.e., whether there are specific parts of the dataset where we may find more hate speech than in other parts of the dataset. To this end, we slice and dice the data in different ways and establish how many hate-labelled tweets we find in each cluster of tweets formed.
5.1. Hate by MP demographics
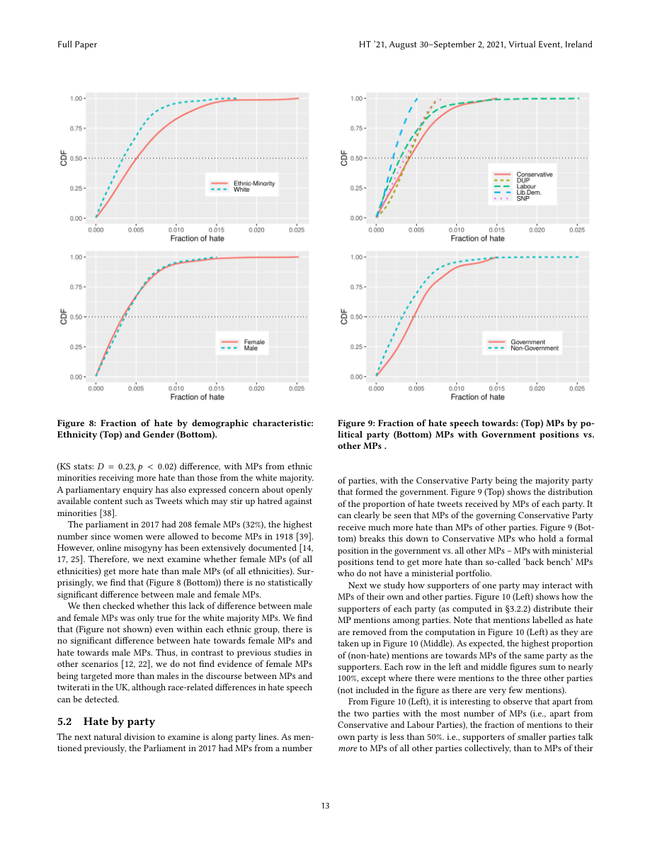
To begin with, we break down the prevalence of hate by two demographic characteristics of MPs: ethnicity and gender. There is no official data that comprehensively records the self-defined ethnicity of MPs, but the British Future think tank compiles a list of ethnic minority MPs following each general election (cf. §3.2.1). The majority (92%) of the MPs were not members of ethnic minorities according to this list. Figure 8 (Top) compares the distribution of hate speech received by white MPs to hate received by ethnic minority MPs. It can be seen that there is a statistically significant
Figure 8: Fraction of hate by demographic characteristic: Ethnicity (Top) and Gender (Bottom).
(KS stats: 𝐷= 0.23, 𝑝< 0.02) difference, with MPs from ethnic minorities receiving more hate than those from the white majority. A parliamentary enquiry has also expressed concern about openly available content such as Tweets which may stir up hatred against minorities [38]. The parliament in 2017 had 208 female MPs (32%), the highest number since women were allowed to become MPs in 1918 [39]. However, online misogyny has been extensively documented [14, 17, 25]. Therefore, we next examine whether female MPs (of all ethnicities) get more hate than male MPs (of all ethnicities). Surprisingly, we find that (Figure 8 (Bottom)) there is no statistically significant difference between male and female MPs. We then checked whether this lack of difference between male and female MPs was only true for the white majority MPs. We find that (Figure not shown) even within each ethnic group, there is no significant difference between hate towards female MPs and hate towards male MPs. Thus, in contrast to previous studies in other scenarios [12, 22], we do not find evidence of female MPs being targeted more than males in the discourse between MPs and twiterati in the UK, although race-related differences in hate speech can be detected.
5.2. Hate by party
The next natural division to examine is along party lines. As mentioned previously, the Parliament in 2017 had MPs from a number
13
Figure 9: Fraction of hate speech towards: (Top) MPs by political party (Bottom) MPs with Government positions vs. other MPs .
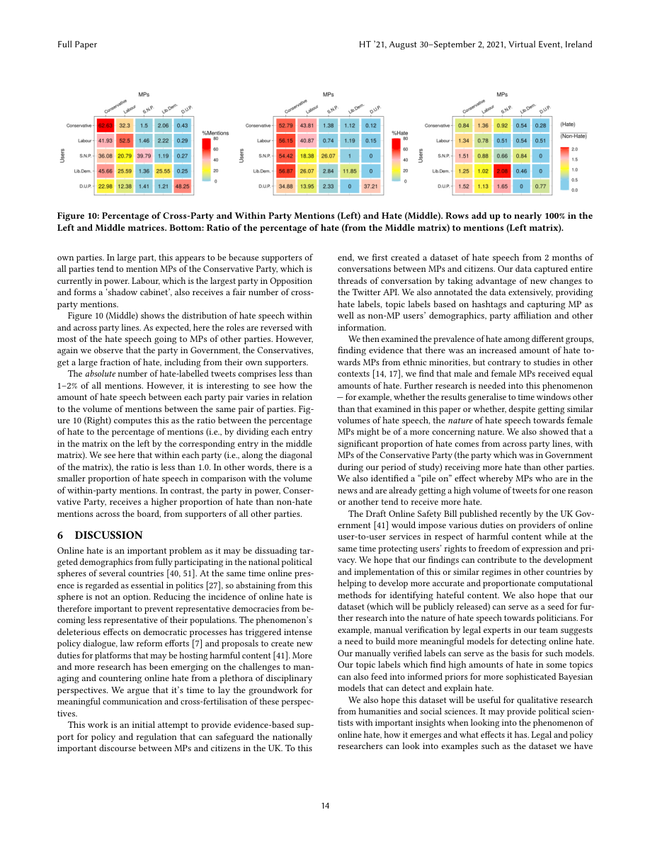
of parties, with the Conservative Party being the majority party that formed the government. Figure 9 (Top) shows the distribution of the proportion of hate tweets received by MPs of each party. It can clearly be seen that MPs of the governing Conservative Party receive much more hate than MPs of other parties. Figure 9 (Bottom) breaks this down to Conservative MPs who hold a formal position in the government vs. all other MPs – MPs with ministerial positions tend to get more hate than so-called ‘back bench’ MPs who do not have a ministerial portfolio. Next we study how supporters of one party may interact with MPs of their own and other parties. Figure 10 (Left) shows how the supporters of each party (as computed in §3.2.2) distribute their MP mentions among parties. Note that mentions labelled as hate are removed from the computation in Figure 10 (Left) as they are taken up in Figure 10 (Middle). As expected, the highest proportion of (non-hate) mentions are towards MPs of the same party as the supporters. Each row in the left and middle figures sum to nearly 100%, except where there were mentions to the three other parties (not included in the figure as there are very few mentions). From Figure 10 (Left), it is interesting to observe that apart from the two parties with the most number of MPs (i.e., apart from Conservative and Labour Parties), the fraction of mentions to their own party is less than 50%. i.e., supporters of smaller parties talk more to MPs of all other parties collectively, than to MPs of their
Figure 10: Percentage of Cross-Party and Within Party Mentions (Left) and Hate (Middle). Rows add up to nearly 100% in the Left and Middle matrices. Bottom: Ratio of the percentage of hate (from the Middle matrix) to mentions (Left matrix).
own parties. In large part, this appears to be because supporters of all parties tend to mention MPs of the Conservative Party, which is currently in power. Labour, which is the largest party in Opposition and forms a ‘shadow cabinet’, also receives a fair number of crossparty mentions. Figure 10 (Middle) shows the distribution of hate speech within and across party lines. As expected, here the roles are reversed with most of the hate speech going to MPs of other parties. However, again we observe that the party in Government, the Conservatives, get a large fraction of hate, including from their own supporters. The absolute number of hate-labelled tweets comprises less than 1–2% of all mentions. However, it is interesting to see how the amount of hate speech between each party pair varies in relation to the volume of mentions between the same pair of parties. Figure 10 (Right) computes this as the ratio between the percentage of hate to the percentage of mentions (i.e., by dividing each entry in the matrix on the left by the corresponding entry in the middle matrix). We see here that within each party (i.e., along the diagonal of the matrix), the ratio is less than 1.0. In other words, there is a smaller proportion of hate speech in comparison with the volume of within-party mentions. In contrast, the party in power, Conservative Party, receives a higher proportion of hate than non-hate mentions across the board, from supporters of all other parties.
6. Discussion
Online hate is an important problem as it may be dissuading targeted demographics from fully participating in the national political spheres of several countries [40, 51]. At the same time online presence is regarded as essential in politics [27], so abstaining from this sphere is not an option. Reducing the incidence of online hate is therefore important to prevent representative democracies from becoming less representative of their populations. The phenomenon’s deleterious effects on democratic processes has triggered intense policy dialogue, law reform efforts [7] and proposals to create new duties for platforms that may be hosting harmful content [41]. More and more research has been emerging on the challenges to managing and countering online hate from a plethora of disciplinary perspectives. We argue that it’s time to lay the groundwork for meaningful communication and cross-fertilisation of these perspectives. This work is an initial attempt to provide evidence-based support for policy and regulation that can safeguard the nationally important discourse between MPs and citizens in the UK. To this
14
end, we first created a dataset of hate speech from 2 months of conversations between MPs and citizens. Our data captured entire threads of conversation by taking advantage of new changes to the Twitter API. We also annotated the data extensively, providing hate labels, topic labels based on hashtags and capturing MP as well as non-MP users’ demographics, party affiliation and other information. We then examined the prevalence of hate among different groups, finding evidence that there was an increased amount of hate towards MPs from ethnic minorities, but contrary to studies in other contexts [14, 17], we find that male and female MPs received equal amounts of hate. Further research is needed into this phenomenon — for example, whether the results generalise to time windows other than that examined in this paper or whether, despite getting similar volumes of hate speech, the nature of hate speech towards female MPs might be of a more concerning nature. We also showed that a significant proportion of hate comes from across party lines, with MPs of the Conservative Party (the party which was in Government during our period of study) receiving more hate than other parties. We also identified a “pile on” effect whereby MPs who are in the news and are already getting a high volume of tweets for one reason or another tend to receive more hate. The Draft Online Safety Bill published recently by the UK Government [41] would impose various duties on providers of online user-to-user services in respect of harmful content while at the same time protecting users’ rights to freedom of expression and privacy. We hope that our findings can contribute to the development and implementation of this or similar regimes in other countries by helping to develop more accurate and proportionate computational methods for identifying hateful content. We also hope that our dataset (which will be publicly released) can serve as a seed for further research into the nature of hate speech towards politicians. For example, manual verification by legal experts in our team suggests a need to build more meaningful models for detecting online hate. Our manually verified labels can serve as the basis for such models. Our topic labels which find high amounts of hate in some topics can also feed into informed priors for more sophisticated Bayesian models that can detect and explain hate. We also hope this dataset will be useful for qualitative research from humanities and social sciences. It may provide political scientists with important insights when looking into the phenomenon of online hate, how it emerges and what effects it has. Legal and policy researchers can look into examples such as the dataset we have
curated in order to formulate evidence-backed regulatory responses to this new problem. Limitations: We are conscious that further research is needed before our findings can be generalised beyond the dataset we use. Our dataset (and any such dataset) has to be specific to a particular time period and geography. Although we believe there are likely common characteristics in hateful speech across borders (that are also reflected in our data set) it could be the case that our dataset only reflects political discussions in the UK; it could also be that the tone and character of such discussions on other platforms or other time periods may be different.
Acknowledgments
We acknowledge the support of University of Surrey (UK) via the QR Strategic Priorities Fund.
References
[1] Pushkal Agarwal, Aravindh Raman, Kiran Garimella, Damilola Ibosiola, Gareth Tyson, and Nishanth Sastry. 2021. Tackling spam in the era of end-to-end encryption: A case study of WhatsApp. arXiv preprint arXiv:2106.05184 (2021). [2] Pushkal Agarwal, Miriam Redi, Nishanth Sastry, Edward Wood, and Andrew Blick. 2020. Wikipedia and Westminster: Quality and dynamics of Wikipedia pages about UK politicians. In Proceedings of the 31st ACM Conference on Hypertext and Social Media. 161–166. [3] Pushkal Agarwal, Nishanth Sastry, and Edward Wood. 2019. Tweeting mps: Digital engagement between citizens and members of parliament in the uk. In Proceedings of the International AAAI Conference on Web and Social Media. [4] Google’s Perspective API. 2021. Using machine learning to reduce toxicity online. https://perspectiveapi.com/. [5] Cedric Burton et al. 2021. European Commission Proposes New Rules for Digital Platforms. http://bit.ly/jdsupra2021. [6] Law Commission. 2020. HARMFUL ONLINE COMMUNICATIONS: THE CRIMINAL OFFENCES. http://bit.ly/harmful2020. [7] Law Commission. 2020. HATE CRIME: CONSULTATION PAPER SUMMARY. http://bit.ly/hate-crime2020. [8] Thomas Davidson, Dana Warmsley, Michael Macy, and Ingmar Weber. 2017. Automated hate speech detection and the problem of offensive language. In Proceedings of the International AAAI Conference on Web and Social Media. [9] Ona de Gibert, Naiara Perez, Aitor Garcıa-Pablos, and Montse Cuadros. 2018. Hate Speech Dataset from a White Supremacy Forum. EMNLP (2018). [10] Agata de Latour, Nina Perger, Ron Salag, Claudio Tocchi, and Paloma Viejo Otero. 2017. We can!: Taking Action against Hate Speech through Counter and Alternative Narratives (revised edition). Council of Europe. [11] Alexandre DE STREEL, Elise Defreyne, Herve Jacquemin, Michele Ledger, and Alejandra Michel. 2020. Online Platforms’ Moderation of Illegal Content Online: Law, Practices and Options for Reform. (2020). [12] Maeve Duggan. 2017. Online harassment 2017. Pew Research Center (2017). [13] Therese Enarsson and Simon Lindgren. 2019. Free speech or hate speech? A legal analysis of the discourse about Roma on Twitter. Information & communications technology law (2019). [14] Eleonora Esposito and Sole Alba Zollo. 2021. “How dare you call her a pig, I know several pigs who would be upset if they knew” A multimodal critical discursive approach to online misogyny against UK MPs on YouTube. Journal of Language Aggression and Conflict (2021). [15] Christian Chukwuebuka Ezeibe and Okey Marcellus Ikeanyibe. 2017. Ethnic politics, hate speech, and access to political power in Nigeria. Africa Today (2017). [16] Antigoni Founta, Constantinos Djouvas, Despoina Chatzakou, Ilias Leontiadis, Jeremy Blackburn, Gianluca Stringhini, Athena Vakali, Michael Sirivianos, and Nicolas Kourtellis. 2018. Large scale crowdsourcing and characterization of twitter abusive behavior. In Proceedings of the International AAAI Conference on Web and Social Media. [17] Tamara Fuchs and Fabian Schäfer. 2019. Normalizing misogyny: hate speech and verbal abuse of female politicians on Japanese Twitter. In Japan forum. Taylor & Francis. [18] British Future. 2017. 52 minority MPs to sit in ‘most diverse UK parliament ever’. https://www.britishfuture.org/52-minority-mps-to-sit-in-most-diverseuk-parliament-ever/. [19] Kiran Garimella, Gianmarco De Francisci Morales, Aristides Gionis, and Michael Mathioudakis. 2018. Political discourse on social media: Echo chambers, gatekeepers, and the price of bipartisanship. In Proceedings of the 2018 World Wide
15
Web Conference. [20] Joshua Garland, Keyan Ghazi-Zahedi, Jean-Gabriel Young, Laurent HébertDufresne, and Mirta Galesic. 2020. Countering hate on social media: Large scale classification of hate and counter speech. In Proceedings of the Fourth Workshop on Online Abuse and Harms. 102–112. [21] Genevieve Gorrell, Mehmet E Bakir, Ian Roberts, Mark A Greenwood, and Kalina Bontcheva. 2020. Which politicians receive abuse? Four factors illuminated in the UK general election 2019. EPJ Data Science (2020). [22] Genevieve Gorrell, Mark A Greenwood, Ian Roberts, Diana Maynard, and Kalina Bontcheva. 2018. Twits, twats and twaddle: trends in online abuse towards UK politicians. In Twelfth international AAAI conference on web and social media. [23] Todd Graham, Marcel Broersma, Karin Hazelhoff, and Guido Van’T Haar. 2013. Between broadcasting political messages and interacting with voters: The use of Twitter during the 2010 UK general election campaign. Information, Communication & Society (2013). [24] Will J Grant, Brenda Moon, and Janie Busby Grant. 2010. Digital dialogue? Australian politicians’ use of the social network tool Twitter. Australian journal of political science (2010). [25] Ella Guest, Bertie Vidgen, Alexandros Mittos, Nishanth Sastry, Gareth Tyson, and Helen Margetts. 2021. An Expert Annotated Dataset for the Detection of Online Misogyny. In Proceedings of European Chapter of the Association for Computational Linguistics. [26] Ehsan Ul Haq, Tristan Braud, Young D Kwon, and Pan Hui. 2020. A survey on computational politics. IEEE Access (2020). [27] Nigel Jackson and Darren Lilleker. 2011. Microblogging, constituency service and impression management: UK MPs and the use of Twitter. The Journal of Legislative Studies (2011). [28] Andreas Jungherr. 2016. Twitter use in election campaigns: A systematic literature review. Journal of Information Technology & Politics (2016). [29] Kaggle. 2018. Jigsaw toxic Comment classification challenge. https://www.kaggle.com/c/jigsaw-toxic-comment-classification-challenge/. [30] Sunder Katwala and Steve Ballinger. 2015. The Race for Representation: How Ethnic Diversity became the ‘New Normal’in British Politics. London: British Future (2015). [31] Karolina Koc-Michalska, Darren G Lilleker, and Thierry Vedel. 2016. Civic political engagement and social change in the new digital age. [32] Darren G Lilleker and Karolina Koc-Michalska. 2013. Online political communication strategies: MEPs, e-representation, and self-representation. Journal of Information Technology & Politics (2013). [33] Darren G Lilleker and Karolina Koc-Michalska. 2017. What drives political participation? Motivations and mobilization in a digital age. Political Communication (2017). [34] Vox Media. 2021. Coral Toxic Comments: Leveraging Google’s Perspective AP. https://docs.coralproject.net/talk/toxic-comments/, accessed on 20 March 2021. [35] Alexandros Mittos et al. 2020. Online Harms: A Meta-Tool for Abusive Speech Detection. https://github.com/amittos/OnlineHarms-Metatool. [36] Joyojeet Pal and Anmol Panda. 2019. Twitter in the 2019 Indian General Elections: Trends of Use Across States and Parties. Economic and Political Weekly (2019). [37] UK Parliament. 2013. Members’ Names Information Service API. https://data. parliament.uk/membersdataplatform/, accessed on 28 April 2021. [38] UK Parliament. 2016. Hate crime: abuse, hate and extremism online. https: //publications.parliament.uk/pa/cm201617/cmselect/cmhaff/609/60902.htm. [39] UK Parliament. 2017. House of Commons Library, General Election 2017: full results and analysis. https://commonslibrary.parliament.uk/research-briefings/ cbp-7979/. [40] UK Parliament. 2019. Written Ministerial Statement by Rt Hon Oliver Dowden MP: Update on Tackling Intimidation in Public Life. https://questionsstatements.parliament.uk/written-statements/detail/2019-11-05/hcws100. [41] UK Parliament. 2021. Draft Online Safety Bill. https://www.gov.uk/government/ publications/draft-online-safety-bill. [42] María Antonia Paz, Julio Montero-Díaz, and Alicia Moreno-Delgado. 2020. Hate speech: A systematized review. Sage Open (2020). [43] James W Pennebaker, Martha E Francis, and Roger J Booth. 2001. Linguistic inquiry and word count: LIWC 2001. Mahway: Lawrence Erlbaum Associates (2001). [44] Juan Carlos Pereira-Kohatsu, Lara Quijano-Sánchez, Federico Liberatore, and Miguel Camacho-Collados. 2019. Detecting and monitoring hate speech in Twitter. Sensors (2019). [45] Nathaniel Persily and Joshua A Tucker. 2020. Social Media and Democracy: The State of the Field, Prospects for Reform. Cambridge University Press. [46] Katarina Pettersson. 2019. Freedom of speech requires actions: Exploring the discourse of politicians convicted of hate-speech against Muslims. European Journal of Social Psychology (2019). [47] James A Piazza. 2020. Politician hate speech and domestic terrorism. International Interactions (2020). [48] Jing Qian, Anna Bethke, Yinyin Liu, Elizabeth Belding, and William Yang Wang. 2019. A Benchmark Dataset for Learning to Intervene in Online Hate Speech. In Proceedings of the Conference on Empirical Methods in Natural Language Processing
and the 9th International Joint Conference on Natural Language Processing (EMNLPIJCNLP). [49] Roderik Rekker and Joost van Spanje. 2021. Hate Speech Prosecution of Politicians and its Effect on Support for the Legal System and Democracy. British Journal of Political Science (2021). [50] Punyajoy Saha, Binny Mathew, Kiran Garimella, and Animesh Mukherjee. 2021. “Short is the Road that Leads from Fear to Hate”: Fear Speech in Indian WhatsApp Groups. In Proceedings of the Web Conference 2021. [51] Jennifer Scott. 2019. Women MPs say abuse forcing them from politics. BBC News. https://www.bbc.co.uk/news/election-2019-50246969. [52] Alexandra A Siegel and Vivienne Badaan. 2020. # No2Sectarianism: Experimental approaches to reducing sectarian hate speech online. American Political Science Review (2020). [53] Yannis Theocharis, Pablo Barberá, Zoltán Fazekas, Sebastian Adrian Popa, and Olivier Parnet. 2016. A bad workman blames his tweets: the consequences of citizens’ uncivil Twitter use when interacting with party candidates. Journal of communication (2016). [54] Gavan Titley, Ellie Keen, and László Földi. 2014. Starting points for combating hate speech online. Council of Europe (2014). [55] Alice Tontodimamma, Eugenia Nissi, Annalina Sarra, and Lara Fontanella. 2021. Thirty years of research into hate speech: topics of interest and their evolution. Scientometrics (2021). [56] Cristian Vaccari. 2013. Digital politics in Western democracies: A comparative study. JHU Press.
16
[57] Betty van Aken, Julian Risch, Ralf Krestel, and Alexander Löser. 2018. Challenges for Toxic Comment Classification: An In-Depth Error Analysis. In Proceedings of the 2nd Workshop on Abusive Language Online (ALW2). [58] Joost Van Spanje and Claes De Vreese. 2015. The good, the bad and the voter: The impact of hate speech prosecution of a politician on electoral support for his party. Party Politics (2015). [59] Bertie Vidgen, Emily Burden, and Helen Margetts. 2021. Understanding online hate: VSP Regulation and the broader context. http://bit.ly/ofcom-turing2021. [60] Jeremy Waldron. 2012. The harm in hate speech. Harvard University Press. [61] Stephen Ward and Liam McLoughlin. 2020. Turds, traitors and tossers: the abuse of UK MPs via Twitter. The Journal of Legislative Studies (2020). [62] Zeerak Waseem and Dirk Hovy. 2016. Hateful symbols or hateful people? predictive features for hate speech detection on twitter. In Proceedings of the NAACL student research workshop. [63] Matthew L Williams, Pete Burnap, Amir Javed, Han Liu, and Sefa Ozalp. 2020. Hate in the machine: Anti-Black and anti-Muslim social media posts as predictors of offline racially and religiously aggravated crime. The British Journal of Criminology (2020). [64] Ellery Wulczyn, Nithum Thain, and Lucas Dixon. 2017. Ex machina: Personal attacks seen at scale. In Proceedings of the 26th international conference on world wide web. [65] Marcos Zampieri, Shervin Malmasi, Preslav Nakov, Sara Rosenthal, Noura Farra, and Ritesh Kumar. 2019. Predicting the Type and Target of Offensive Posts in Social Media. In Proceedings of the Association for Computational Linguistics: Human Language Technologies.
Do you like what you are reading? Subscribe to receive updates.
Unsubscribe anytime