

Detecting the Correlation between Sentiment and User-level as well as Text-Level Meta-data from Benchmark Corpora
Authors: Shubhanshu Mishra and Jana Diesner
Session 1: Computational Social Science HUMAN’18, July 9, 2018, Baltimore, MD, USA
Detecting the Correlation between Sentiment and User-level as
well as Text-Level Meta-data from Benchmark Corpora∗
Shubhanshu Mishra University of Illinois at Urbana-Champaign
School of Information Sciences
Champaign, Illinois smishra8@illinois.edu
ABSTRACT
Do tweets from users with similar Twitter characteristics have similar sentiments? What meta-data features of tweets and users correlate with tweet sentiment? In this paper, we address these two questions by analyzing six popular benchmark datasets where tweets are annotated with sentiment labels. We consider user-level as well as tweet-level meta-data features, and identify patterns and correlations of these feature with the log-odds for sentiment classes. We further strengthen our analysis by replicating this set of experiments on recent tweets from users present in our datasets; finding that most of the patterns are consistent across our analysis. Finally, we use our identified meta-data features as features for a sentiment classification algorithm, which results in around 2% increase in F1 score for sentiment classification, compared to text-only classifiers, along with a significant drop in KL-divergence. These results have potential to improve sentiment analysis applications on social media data.
CCS CONCEPTS
• Information systems →Sentiment analysis; Social networks; • Human-centered computing →Social media; • Computing methodologies →Supervised learning;
KEYWORDS
Social media data, Social media meta-data, Sentiment analysis, Statistical analysis
ACM Reference Format: Shubhanshu Mishra and Jana Diesner. 2018. Detecting the Correlation between Sentiment and User-level as well as Text-Level Meta-data from Benchmark Corpora. In HT ’18: 29th ACM Conference on Hypertext and Social Media, July 9–12, 2018, Baltimore, MD, USA. ACM, New York, NY, USA, 9 pages. https://doi.org/10.1145/3209542.3209562
∗Produces the permission block, and copyright information
Permission to make digital or hard copies of all or part of this work for personal or classroom use is granted without fee provided that copies are not made or distributed for profit or commercial advantage and that copies bear this notice and the full citation on the first page. Copyrights for components of this work owned by others than ACM must be honored. Abstracting with credit is permitted. To copy otherwise, or republish, to post on servers or to redistribute to lists, requires prior specific permission and/or a fee. Request permissions from permissions@acm.org. HT ’18, July 9–12, 2018, Baltimore, MD, USA © 2018 Association for Computing Machinery. ACM ISBN 978-1-4503-5427-1/18/07...$15.00 https://doi.org/10.1145/3209542.3209562
Jana Diesner University of Illinois at Urbana-Champaign
School of Information Sciences
Champaign, Illinois jdiesner@illinois.edu
1 INTRODUCTION
Sentiment prediction is a well-studied text classification problem [10, 20] that has mostly been applied to reviews, e.g., of movies [21, 23] and consumer products [20]. Sentiment analysis is also frequently used to identify the valence of social media posts and other types of text data [4, 6, 19]. Additionally, sentiment detected from text data has been shown to be useful for being correlated with or predicting individual as well as aggregated behavior, e.g., the political leaning of people [25] or stock market trends [3]. Many of these applications involve quantifying the distribution of sentiment classes, a task that is commonly referred to as sentiment quantification [5].
A major limitation of existing sentiment classification systems, when applied in the social media domain, is their reliance on mainly the text content of a post or tweet. However, platforms such as Twitter provide access to rich meta-data along with the text of the post. These meta-data include properties of social media posts and their authors, which may provide useful context for studying the sentiment conveyed in a tweet, and can complement the text features for the sentiment classification task. Earlier research has used tweetbased meta-data, such as the existence or number of URLs, hashtags, and mentions, as features for tweet sentiment classification [12, 13], as well as user-level meta-data for creating sentiment-based user networks [12]. However, there is a limited body of literature on using or incorporating meta-data of tweets for improving sentiment classification, and most of this prior work is based on non-public and non-standard datasets [24, 26]. With this paper, we aim to contribute to a more comprehensive understanding of the relationship between these meta-data features and the sentiment of tweets across multiple datasets. This work is enabled by the availability of large-scale standardized sentiment-annotated Twitter corpora, such as the Semantic Evaluation’s Twitter sentiment task corpus [15, 16, 22], another recently available dataset of 1.6 million multilingual tweets [14], and a few other public datasets, which allow us to search for the existence of any meaningful relationships between the meta-data of tweets and tweet sentiment.
In this paper, we identify how various meta-data are (on average) related to the sentiment of tweets in existing sentiment annotated benchmark corpora. Our analysis is limited in that we identify patterns at an aggregate level across all datasets considered. However, we further support our observations by including additional data from users in our dataset, and observing the correlation between meta-data and sentiment (as predicted by a baseline classifier). The goal of this research is to understand the distribution of meta-data characteristics across these datasets, and to identify if these metadata can reveal biases in sentiment annotation. Finally, we also
Session 1: Computational Social Science HUMAN’18, July 9, 2018, Baltimore, MD, USA
detect how using these meta-data can help as features in a classifier to improve sentiment classifiers as well as sentiment quantification.
Our contributions with this paper are 1) an analysis of the relationship between sentiment (as per annotation) of tweets and tweet meta-data, 2) a validation of observed relationships between sentiment and meta-data by using additional tweets from users in benchmark data annotated with sentiment using a baseline classifier, 3) using the meta-data of tweets along with tweet text content for predicting sentiment, 4) a system called Meta-data Enhanced Sentiment Classification (MESC) for efficiently incorporating metadata-based sentiment information of a tweet into existing text-based classifiers in a model-agnostic way, and 5) demonstrating the use of standard sentiment classification datasets for non-text-based sentiment analysis, thereby providing a baseline to compare other work against. The code reproducing this work as well as additional supplementary analysis is available at: https://github.com/napsternxg/TwitterSentimentBenchmarks
2 BACKGROUND
Achieving high accuracy rates for sentiment classification is challenging, especially for social media data. This is evident from the top accuracy rates of state of the art systems, which are often below 90% for movie reviews [8, 23], and even lower for Twitter data [1, 15–18, 22]. One possible reason for this effect is the occasionally implicit assumption that the sentiment of a post is fully conveyed in the text; disregarding the text’s context. Furthermore, sentiment classification models based on text do not necessarily perform well when applied across domains [13] due to factors such as diverse language use, concept evolution, and concept drift [11]. Recently, there has been an interest in quantifying the distribution of sentiment in a given collection of tweets [5, 15]. This topic deals with the focus of earlier studies on using aggregates of sentiment distributions to model changes in peopleâĂŹs mood[3], election results [25], reviews [2], and the stock market [3]. Our approach is methodologically closest to the research by Tan and colleagues [24], who used the full network of user follower, friend, and user mention along with the tweet text to infer the sentiment of tweets by using a computationally expensive graphical model. Our approach differs from that in several ways; for example, we only conduct analyses at the aggregate level of user and tweet meta-data, and our method can more easily be plugged into existing systems where text-based sentiment classification is already implemented.
3 DATA
Most existing sentiment datasets categorize the data into three classes, namely negative, neutral, and positive. We use the same set of labels for our analysis, and only consider datasets annotated with those labels. Additionally, we also consider a different set of binary class labels to identify if tweets are opinionated (either positive or negative) or non-opinionated (neutral). Furthermore, we selected only datasets with tweet IDs for each tweet label. This is important for collecting user and tweet-level meta-data using the Twitter API. Finally, to infer any meaningful relationship between meta-data and sentiment labels, we want to avoid any dataset specific idiosyncrasies in annotation and tweet distribution. We address this bias mitigation need by using sentiment labeled datasets from various
time periods, on different topics, and labeled by using different annotation guidelines and interfaces (but still the same classes). Using this approach, we hope to infer general relationships between tweet meta-data and sentiment labels after pooling the selected eligible datasets.
Based on our above-mentioned criteria, we identified six high quality, publicly available datasets as eligible for our analysis. The first dataset (referred to as SemEval) is from the recurring Twitter sentiment classification task of SemEval [15, 18, 22], and includes all training, development, and test data from 2013 throughout 2016. We only consider the data for the tasks where the goal was to classify tweet sentiment as either negative, neutral, or positive. The second dataset is a large collection of multilingual tweets from European countries from a study by Mozetič and colleagues [14]. We only work with the English tweets from this dataset. This dataset is available on the CLARIN data repository and therefore referred to as Clarin. The next two datasets, namely, Airline and GOP, were generated on the Crowdflower platform and hosted on Kaggle1. These two datasets include crowd sourced sentiment annotations for tweets about various Airlines as well as the first GOP debate of 2016. The final two datasets come from Saif and colleagues [23], and are about the Obama-McCain debate (referred as Obama) and healthcare (referred as Healthcare).
Our analysis considers user-level and tweet-level meta-data. Since the Twitter terms of service do not allow for tweet data to be (re-)distributed, we collected the tweet JSON data using the Twitter API, and then merged these data with the labels provided in each dataset. For evaluating the effect of meta-data features on tweet classification, we consider a training, development, and test split of each dataset. For the SemEval dataset, we use the provided training, development, and test splits, while for the other datasets, we create training, development, and test splits using a 72%, 8%, and 20% ratio of the datasets. The frequency of instances across the various datasets, labels, and data splits is presented in Table 1. Furthermore, the aggregate distribution of instances across the datasets and labels is presented in Figure 1a. This figure shows that our datasetś sizes are distributed across three orders of magnitude: large datasets with numbers of instances around 40K-60K, which include SemEval and Clarin, followed by smaller datasets, which are Airline and GOP, and finally, the smallest dataset of around 2K instances, namely Obama and Healthcare.
A major strength of the set of datasets that we consider is its temporal diversity, with tweet instances ranging from 2008 to 2016 (Figure 1). Both SemEval and Clarin were collected over lengthy time-periods (SemEval during 2011-16, Clarin during 2013-15) [14, 18]. However, the English tweets in the Clarin dataset are limited to 2014. The Healthcare dataset spans seven months between 2009- 2010. The Airline dataset entails 2 days (2015), and the GOP (2015) and Obama (2008) datasets span 1 day each. All other datasets cover a shorter duration. A possible limitation with existing research on Twitter sentiment classification is the analysis of tweets from a specific period, which may result in a failure to capture trends across years as well as in overfitting on trends from a specific period. Using multiple datasets in this study aims at mitigating this issue.
1https://www.kaggle.com/crowdflower/datasets
Session 1: Computational Social Science HUMAN’18, July 9, 2018, Baltimore, MD, USA
Table 1: Distribution of the instances across datasets, labels, and data splits.
Dataset Train Development Test Total
Labels Negative Neutral Positive Negative Neutral Positive Negative Neutral Positive Airline 5,515 1,843 1,467 613 205 163 1,532 512 408 12,258 Clarin 11,485 19,418 13,496 1,276 2,158 1,500 3,191 5,394 3,749 61,667 GOP 4,230 1,818 1,173 471 202 130 1,175 505 326 10,030 Healthcare 834 378 321 93 42 36 232 106 89 2,131 Obama 715 707 455 80 79 50 199 197 126 2,608 SemEval 4,313 13,031 11,405 479 1,448 1,268 1,198 3,620 3,169 39,931
Freq. of
tweets
103
103
101
101
positive
neutral
negative
Obama
Healthcare
SemEval
Clarin
Airline
GOP
label
dataset
103
103
101
101
2008 2009 2010 2011 2012 2014 2015 2016
2008 2009 2010 2011 2012 2014 2015 2016
Year
Year
Figure 1: Frequency of sentiment labels across datasets and years. Opinionated tweet are either positive or negative.
103
103
103
0 5 Order(Followers)
0.0 2.5 5.0 Order(Friends)
104 105
104 105
104 105
False True User is verified
False True User has URL
100 103
100 103
103
0.0 2.5 5.0 Order(Statuses)
0 2 Order(Account Age)
104 105
False True Tweet is reply
False True Tweet is quote
100 103
0 2 4 6 8 10 12 14 Number of hashtags
Figure 2: Frequency of user-level and tweet-level meta-data. Order(x) = log10(x)
For each tweet instance in our dataset, we extract a) user-level, and b) tweet-level meta-data from each tweet’s JSON files. User meta-data includes number of statuses, followers, and friends, user account age (in days) based on account creation date and tweet creation date, if the user account is verified, and if the user profile
has a URL. Tweet meta-data includes number of mentions, URLs, and hashtags, if the tweet is a retweet, and if the tweet quotes another tweet.
Since the distribution of the user-level meta-data is highly skewed and the tail of this distribution extends to large values, we transform
Session 1: Computational Social Science HUMAN’18, July 9, 2018, Baltimore, MD, USA
the values by using a log transform with base 10, capturing their order. This allows our analysis to be robust to changes in metadata values for user accounts over time as the log value changes are gradual compared to raw count changes. A distribution of the user and tweet meta-data is shown in Figure 2. Finally, a major advantage of jointly considering multiple datasets is that they are freer from selection and annotation biases than single sets with respect to the properties we are studying. It is common practice to perform the annotation task using only the text of the tweet [16], hence any bias in annotation because of user-level meta-data features being studied is less likely. We do acknowledge that the actual original tweet collections might still feature multiple types of sampling biases.
4 METHODS
In the following sections, we describe our methods for analyzing the relationship of sentiment with user and tweet level meta-data.
4.1 Relationship between sentiment and user meta-data
We define the following properties of a user and the respective measurement of these properties from the user meta-data:
(1) Activity level is measured in terms of the number of sta-
tuses posted by the user. (2) Social status of a user is defined as the amount of incoming
connections to the user on the platform, and measured as the number of followers of the user. (3) Social interest of a user is defined as the amount of outgo-
ing connections user make on the platform. The Twitter API defines this measure as the number of friends of a user. We measure it as the number of users that a user follows. (4) Account age is measured as the number of days that the
account has existed until the user posted a given tweet. (5) Profile authenticity is measured using Twitter specific in-
formation, such as presence of a URL in the user profile, as well as the Twitter-provided verified user tag. This is a categorical measure.
As mentioned earlier, each numeric measure was analyzed using its order instead of the raw count. The order is defined as
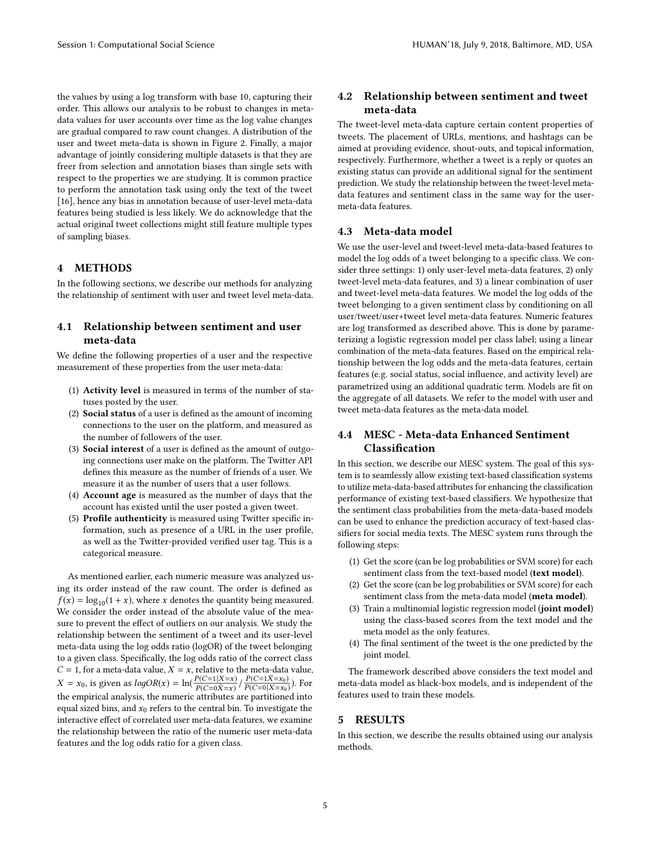
f (x) = log10(1 + x), where x denotes the quantity being measured. We consider the order instead of the absolute value of the measure to prevent the effect of outliers on our analysis. We study the relationship between the sentiment of a tweet and its user-level meta-data using the log odds ratio (logOR) of the tweet belonging to a given class. Specifically, the log odds ratio of the correct class C = 1, for a meta-data value, X = x, relative to the meta-data value, X = x0, is given as loдOR(x) = ln( P(C=1|X =x)
P(C=0 ¯X =x) / P(C=1 ¯X=x0)
P(C=0|X =x0)). For the empirical analysis, the numeric attributes are partitioned into equal sized bins, and x0 refers to the central bin. To investigate the interactive effect of correlated user meta-data features, we examine the relationship between the ratio of the numeric user meta-data features and the log odds ratio for a given class.
4.2 Relationship between sentiment and tweet meta-data
The tweet-level meta-data capture certain content properties of tweets. The placement of URLs, mentions, and hashtags can be aimed at providing evidence, shout-outs, and topical information, respectively. Furthermore, whether a tweet is a reply or quotes an existing status can provide an additional signal for the sentiment prediction. We study the relationship between the tweet-level metadata features and sentiment class in the same way for the usermeta-data features.
4.3 Meta-data model
We use the user-level and tweet-level meta-data-based features to model the log odds of a tweet belonging to a specific class. We consider three settings: 1) only user-level meta-data features, 2) only tweet-level meta-data features, and 3) a linear combination of user and tweet-level meta-data features. We model the log odds of the tweet belonging to a given sentiment class by conditioning on all user/tweet/user+tweet level meta-data features. Numeric features are log transformed as described above. This is done by parameterizing a logistic regression model per class label; using a linear combination of the meta-data features. Based on the empirical relationship between the log odds and the meta-data features, certain features (e.g. social status, social influence, and activity level) are parametrized using an additional quadratic term. Models are fit on the aggregate of all datasets. We refer to the model with user and tweet meta-data features as the meta-data model.
4.4 MESC - Meta-data Enhanced Sentiment Classification
In this section, we describe our MESC system. The goal of this system is to seamlessly allow existing text-based classification systems to utilize meta-data-based attributes for enhancing the classification performance of existing text-based classifiers. We hypothesize that the sentiment class probabilities from the meta-data-based models can be used to enhance the prediction accuracy of text-based classifiers for social media texts. The MESC system runs through the following steps:
(1) Get the score (can be log probabilities or SVM score) for each
sentiment class from the text-based model (text model). (2) Get the score (can be log probabilities or SVM score) for each
sentiment class from the meta-data model (meta model). (3) Train a multinomial logistic regression model (joint model)
using the class-based scores from the text model and the meta model as the only features. (4) The final sentiment of the tweet is the one predicted by the
joint model.
The framework described above considers the text model and meta-data model as black-box models, and is independent of the features used to train these models.
5 RESULTS
In this section, we describe the results obtained using our analysis methods.
Session 1: Computational Social Science HUMAN’18, July 9, 2018, Baltimore, MD, USA
5.1 Relationship between sentiment and user meta-data
The relationship between the log odds ratio of a tweet belonging to a given class based on various meta-data features is shown in Figure 3.
First, we discuss the correlation between a tweet user’s activity level (order of statuses) with the sentiment label. We observe positive linear trend in the log odds ratio of a tweet being neutral with the activity level of its users. This might be partially explained by the fact that many of the accounts with high numbers of statuses are corporate or organizational accounts, e.g., @AmazonHelp, which has posted 1.25M statuses. These accounts might be less likely to engage in opinionated conversations. However, the relationship for low activity levels is highly variable, suggesting higher sentiment diversity in low activity users. Additionally, we observed that the overall relationship between activity and sentiment also holds for each of the individual datasets. Furthermore, tweets from users with mean activity level are more likely to be opinionated. Amongst the activity levels of opinionated users, we observe a quadratic relationship between the tweet being labeled as positive and the user having more than 10 tweets (order 1). This suggests that these median activity level users are more likely to tweet with positive sentiment, compared to others. However, no such trend is seen for the negative class, where the downward trend plateaus after the median activity level.
Second, we consider the effect of the user’s social status (the order of the number of followers of the user) on predicting the sentiment of the tweet. Figure 3a shows a strong quadratic trend across all classes for this feature. Tweets from high follower accounts are more likely to be more neutral than opinionated.
Third, we examine the relationship between tweet sentiment and the users social interest (as quantified by the order of the number of followers of the user). Figure 3a shows a strong quadratic relationship between both variables for the positive class. Furthermore, as the order of number of friends increases, the tweets from those users are less likely to be neutral, and more likely to be negative after crossing the median value. This might reflect that users with extreme social interest (as defined in this paper, i.e., either very low or very high order of number of users they follow) are less likely to post positive tweets, while the average social interest users might be more likely to express positive sentiments.
Fourth, the account age significantly correlates with the sentiment classes: older accounts tend to post less positive or neutral tweets, and are more likely to post negative tweets. This might reflect veteran users who criticize issues or actively take part in social media conversations rather than just sharing neutral tweets.
Fifth, we study the user meta-data features that reflect profile authenticity (results shown in Figure 3b). We found that the presence of a URL in the user’s profile is correlated with user postings being more neutral or positive, while the lack of a URL reflects a higher likelihood of negative tweets. Similarly, verified users are more likely to post neutral tweets compared to non-verified users. Both findings suggest that user authenticity is related to opinionated tweeting behavior. This trend might suggest that non-authentic users are more likely to share negatively perceived posts, while authentic profiles share more positive and neutral posts.
Finally, to test for the correlation of features, we further examined the Pearson correlation between the numeric features. We observe a positive correlation between measures of social status and social interest. We also observe a low positive correlation between social activity and social status. Based on this insight, we further examine the relationship between the sentiment class with the ratio of the numeric user-level meta-data features. These quantities are provided in Figure 4.
We found a strong relationship between the order of ratio of statuses and friends across all sentiment classes. Specifically, the log odds of neutral sentiment increases as the order of the ratio increases, while it decreases for negative sentiment. This reflects that for low order ratio neutral tweets are less likely compared to high order ratio. This may suggest that users with a high number of statuses compared to their number of friends are mostly sharing neutral (non-opinionated) content (like the @AmazonHelp account mentioned before).
5.2 Relationship between sentiment and tweet meta-data
We now turn to the relationship between tweet sentiment and tweetlevel meta-data (Figure 3b). A distinct pattern can be seen between the number of URLs and the sentiment class: as the number of URLs increases, the probability of the tweet being neutral also increases. This might be partially accounted for by the fact that news agencies or blogging services share the URL of their content via Twitter. This results in most of these tweets being of neutral sentiment. Furthermore, the presence of a URL in non-neutral tweets is more likely to reflect a positive tweet. We also observe a decline in the probability of a negative tweet with an increase in the number of user mentions in a tweet. However, Figure 6b shows that tweets that are replies or direct quotes are more likely to be negative than neutral or positive.
5.3 Analysis with additional user tweets
The analyses up here have focused on sentiment-annotated data where the original annotators used the text of a given tweet to provide a sentiment label. One valid criticism of studying correlations between user meta-data and sentiment is that a tweet may exhibit multiple sentiments. However, in this study, we are only interested in the most common patterns of relationships between sentiments of tweets and its meta-data. Furthermore, we are not interested in causal analyses, but in the correlation between sentiment and meta-data features. More specifically, our current analysis is only reflective of the expected and most likely correlation of a user or tweet and the meta-data.
We conduct an additional set of experiments, this time based on data from all 110,388 users in our dataset and collect their most recent 200 tweets (for 98% of the users we were able to collect more than 190 tweets). The choice of the number of recent tweets was made to reduce the computational complexity of processing the data. We collected around 20 million tweets from the users in our dataset. Since this data was not annotated with sentiment, we decided to annotate it with a highly accurate lexicon and rule-based sentiment analysis system tailored for Twitter data (Vader Sentiment) [7]. Once the sentiment labels were assigned, we conducted the same
Session 1: Computational Social Science HUMAN’18, July 9, 2018, Baltimore, MD, USA
0.25
positive
0.0
0.0
0.0
0.00
0.2
0.5
0.25
0.5
0.4
0 5
0 5
0 5
0 2
1
0.5
neutral
0.5
0.0
0
0.0
0.2
0.0
0.5
1
0.4
0 5
0 5
0 5
0 2
1
0.5
negative
1
0.0
0
0
0.0
0.5
1
1
0 5 Order of statuses
0 5 Order of followers
0 5 Order of
0 2 Order of user age
friends
User is verified
User has URL
positive
label
neutral
negative
0.2 0.1 0.0 0.1 0.2
0.2 0.1 0.0 0.1
2
2
positive
2.5
0
0
0.0
2
2
0 5 10
0 5 10
0 2 4
2.5
neutral
0
2
0.0
2
0
2.5
2
0 5 10
0 5 10
0 2 4
1
negative
2.5
2
0
0.0
1
0
0.0 2.5 5.0 7.5 Number of
0 5 10 Number of
0 2 4 Number of
Hashtags
Mentions
URLs
Tweet is reply
Tweet is quote
positive
label
neutral
negative
0.10 0.05 0.00 0.05 0.10 0.15
0.15 0.10 0.05 0.00 0.05 0.10
(b) Tweet-level meta-data Figure 3: Meta-data features vs. sentiment classes. Y-axis in top plots and X-axis in bottom plots, is log-odds ratio, with respect to point at dashed lines.
positive
1 0 1
0
0
1
1
0 2 4
0 2 4
0 2 4
neutral
1
1 0 1
1
0
0
0 2 4
0 2 4
0 2 4
negative
0
0.0
0
1
2
2.5
0 2 4 O rder of statuses/follow ers
0 2 4 O rder of statuses/friends
0 2 4 O rder of follow ers/friends
Figure 4: Ratio of user meta-data features vs. sentiment
analyses as before for the various meta-data feature categories. Our results are presented in Figure 5.
Among categorical attributes, the observed trends are consistent with our findings (Figure 3) for user-level attributes except for the correlation between positive sentiment and the user profile having a URL (see Figure 5a). For the latter case, the results show a reversal in the correlation, but this can be attributed to the low correlation in our original analysis. For tweet quotes, we see quite a different trend for the positive and negative label, which is likely to be caused by the classifier inaccuracy. Similar patterns persist for the numerical attributes: we observe similar but more noisy (compared to the human annotated data) patterns for all numerical user meta-data (Figure 5b). Note that these plots differ in the log odds ratio values from previous plots because of the selection of different baseline values. Another important point is the general trend for each of the curves, which are similar to those observed in the analysis based on the annotated data. Finally, we found that the patterns of ratio of user-level meta-data from our original data analysis are persistent in this version of the data. Figure 5c shows that the trends are similar to those observed in the original data,
with the exception of neutral sentiment for the statuses/followers plot.
5.4 Meta-data model
First, we consider the aggregated effect of using all user-level metadata features in modeling the probability of a given sentiment of a tweet. Table 2 shows the model parameters for each sentiment class. The model parameters confirm the observation of high user activity levels being correlated with higher odds of neutral sentiment and low odds of negative or neutral sentiment (Figure 3a). Similarly, average activity levels are associated with a higher probability of positive as well as negative sentiments. Similarly, the relationships for social interest are also consistent with the earlier observation that greater social interest is related to more negative tweet sentiment. Additionally, we observe that the coefficients of social status are very small and not particularly significant for all sentiment classes. Furthermore, the strong relationship between profile authenticity and sentiment class holds true across all three sentiment classes. This confirms the earlier observation that profile authenticity might be correlated with tweet sentiment.
Second, we model all tweet-level meta-data measures (like the process used for the user meta-data) to study their cumulative effect on the odds of each sentiment class. Table 2 shows the model coefficients for each sentiment class. This model confirms our empirical observations: high numbers of URLs increase the probability of a neutral sentiment, while decreasing the probability of negative and positive sentiment. This effect is larger for negative sentiment. However, the trend is reversed for the number of user mentions. The tweet-level meta-data model associates large number of mentions with slightly higher odds of negative sentiment compared to positive and neutral sentiment. Furthermore, we observe a new pattern in the number of hashtags and the sentiment classes, indicating that higher numbers of hashtags are related to more negative sentiment.
Session 1: Computational Social Science HUMAN’18, July 9, 2018, Baltimore, MD, USA
positive
0
0
0
2
2
2
sentiment
User has URL
User is verified
neutral positive
2.5 5.0 7.5
2.5 5.0 7.5
neutral
negative
2
1
1
0
0.2 0.0
0.2 0.0
0
0
sentiment
Tweet is reply
Tweet is quote
2.5 5.0 7.5
2.5 5.0 7.5
neutral positive
negative
0
0
0
negative
1
1
1
0.0 0.5
0.0 0.2
2.5 5.0 7.5 Order of statuses
2.5 5.0 7.5 Order of followers
(a) Categorical meta-data
positive
0
0.0
0.0
0.25
2
0.00
2.5
2.5
0.25
2.5 5.0
2.5 5.0 7.5
2.5 5.0
2.5 5.0
2 4
1
neutral
0.25
2
2.5
0.00
0
0
0.0
0.25
2.5 5.0
2 4
2.5 5.0
2.5 5.0 7.5
2.5 5.0
negative
1
2
0.1 0.0 0.1
0
0
0
1
2.5 5.0 Order of
2 4 Order of user age
2.5 5.0 Order of statuses/followers
2.5 5.0 7.5 Order of statuses/friends
2.5 5.0 Order of followers/friends
friends
(b) User-level numerical meta-data
(c) Ratio of user-level numerical meta-data
Figure 5: Meta-data features vs. sentiment classes using recent 200 tweets for each user in the data. Sentiment predicted using VADER Sentiment [7]. X-axis in 5a, and Y-axis in 5b and 5c are log-odds ratio, with respect to point at the dashed lines.
Next, we consider the joint effect of the user and tweet-level metadata on modelling the probability of the sentiment classes. Table 2 shows the coefficients of the joint model per class. We observe that the effects of the profile authenticity remain quite close to its value in the user meta-data models. We make the same observation for the activity levels, social interest effects, and the tweet meta-data measures. Overall, we observe that after controlling for all other factors, social status is less correlated with any of the sentiment classes.
5.5 Evaluation of the MESC system
In this section, we evaluate our MESC (Meta-data Enhanced Sentiment Classification) system using a simple text-based as well as our meta-data-based sentiment classifier. For the text model, we consider a unigram bag-of-words (BOW) model, where each word was lower-cased. We removed all user mentions, hashtags, and URLs from the tweet text. Finally, we use the TF-IDF (termfrequency inverse-document frequency) weight for each unigram as the feature of each tweet. The text model is trained using a multinomial logistic regression, which is suitable for modelling the predicted probabilities for each sentiment class. For the meta model, we trained a multinomial logistic regression classifier using the user+tweet meta model features described above. Finally, the joint model uses a linear combination of the class scores (log probabilities) from the text and the meta model, as well as the pairwise products between the scores from the text and the meta model. Evaluation of sentiment classification was done using the overall accuracy, macro-averaged value for precision, recall, and F1 score. Table 3 shows that the joint model results in significant gains over the text-based model on all the datasets. The gain is especially evident for the Healthcare, GOP, and SemEval datasets, where the F1 score of the joint model on the test data increases by 8.5%, 4.2% and 1.9%, respectively. The lack of significant improvement on the Clarin dataset is probably because the simple text-based model is already performing at the level of inter annotator agreement between the tweets as reported in [14]. Finally, we studied the effect of using the joint model for quantifying the distribution of tweets. For this analysis, we only considered the test dataset, and compared the true class distribution to the predicted distribution of classes from the various models using Kullback-Leibler (KL) divergence [9] (a standard measure for measuring the distance between probability
distributions) as used in prior research [5]. Table 3 shows that the distributions produced by the joint model is closer to the true distribution compared to the text-based model. The overall evaluation of the models on the test data is presented in Table 3. We observe that the recall and F1 scores of the joint model are consistently higher than for the text model (by 0.5-4%), however, there is a slight dip in precision and accuracy. The lower precision and accuracy, whereas higher recall and F1, for the text joint models compared to text-based models reflects the ability of the joint models to correctly predict a larger proportion of labels at the cost of increasing the mistakes on these predictions.
6 DISCUSSION AND CONCLUSION
We have presented an analysis of the relationship between various meta-data features and the sentiment of tweets. Our findings suggest that certain user characteristics, such as their activity levels, profile authenticity, and the amount of profiles the users follow, can be highly correlated with the sentiment labels of tweets. Our proposed approach for integrating sentiment information correlated with meta-data into existing text-based classifiers results in a consistent increase in evaluation performance for sentiment classification and quantification tasks. We believe that this approach of using the meta-data-based sentiment correlation information of the tweets can serve as a prior for machine learning, which helps to improve the classification performance of text-based systems. This may be especially useful in cases where the tweet text has a high out of vocabulary (OOV) token rate. One major limitation of our approach is the usage of linear and pairwise combinations of prediction scores from the base model as well as the meta-data-based model. Although this approach results in a simple combination of models, more sophisticated approaches using deep neural networks can also be used for improving the prediction accuracy for the joint models. Furthermore, in our current experiments we used a standard unigram-based sentiment prediction model as a text model. It can be improved by using more sophisticated text classification algorithms based on current state of the art practices, thereby allowing us to further investigate the benefits of using meta-data models.
Another limitation of our analysis is the availability of labeled corpora that are annotated based on the text of the tweet. A more rigorous evaluation of our method could be done by annotating
Session 1: Computational Social Science HUMAN’18, July 9, 2018, Baltimore, MD, USA
Table 2: Feature weights for models of tweet sentiment based on user and tweet metadata. () marked coefficients are statistically NOT significant (p > 0.005)
Model types User Tweet User + Tweet
Labels Negative Neutral Positive Negative Neutral Positive Negative Neutral Positive Intercept -0.79 0.02 -1.78 -0.85 -0.56 -0.69 -0.55 -0.36 -1.54 Activity level -0.75 0.31 0.47 - - - -0.72 0.28 0.47 Activity level ^2 0.08 -0.01 -0.08 - - - 0.08 -0.01 -0.08 Social status -0.11 -0.09 0.17 - - - -0.13 -0.04 0.13 Social status^2 0.00 0.01 -0.01 - - - 0.01 0.00 -0.00 Social interest 0.51 -0.6 0.34 - - - 0.27 -0.36 0.26 Social interest^2 -0.05 0.08 -0.07 - - - -0.02 0.04 -0.05 Account age 0.34 -0.17 -0.13 - - - 0.37 -0.2 -0.13 User has URL -0.32 0.22 0.07 - - - -0.22 0.1 0.1 User verified -0.11 0.26 -0.21 - - - -0.15 0.29 -0.21 # Mentions - - - 0.3 -0.07 -0.22 0.13 0.08 -0.23 # Hashtags - - - 0.73 -0.22 -0.47 0.78 -0.24 -0.5 # URLs - - - -4.09 3.35 -0.73 -3.94 3.19 -0.67 Is reply - - - 0.05 0.05 -0.1 0.03 0.06 -0.09 Is quote - - - 1.17 -0.75 -0.05 1.1 -0.68 -0.05
Table 3: Evaluation scores of various models on the test split across all datasets. (Acc.=accuracy, P=precision, R=recall, F1=F1 score, KLD=KL divergence). Acc., P, R, F1 are measured as percentages and higher score means better. For KLD lower means better.
Dataset Model Acc. P R F1 KLD
meta 63.9 61.1 36.8 32.8 0.663 text 80.0 78.3 69.0 72.4 0.026 joint 80.3 76.6 72.0 74.0 0.005
Airline
meta 45.7 42.1 40.9 37.8 0.238 text 64.1 64.5 62.2 62.9 0.012 joint 64.1 64.0 63.0 63.4 0.000
Clarin
meta 59.9 54.3 37.5 33.6 0.776 text 66.4 63.7 51.4 53.6 0.111 joint 65.6 59.9 56.5 57.8 0.006
GOP
meta 56.7 36.8 39.4 35.1 0.717 text 64.2 71.3 49.5 51.0 0.233 joint 65.6 61.6 58.3 59.5 0.007
Healthcare
meta 39.3 37.0 35.1 32.0 0.282 text 61.5 64.8 59.7 60.9 0.030 joint 62.3 63.2 61.6 62.2 0.002
Obama
meta 47.0 31.0 36.2 33.0 0.845 text 65.5 64.1 58.0 59.5 0.032 joint 65.6 62.7 60.5 61.4 0.001
SemEval
tweets based on both their meta-data and text content. This can help to better understand if the human annotators change their mind about the best fitting sentiment label when they also consider the meta-data of tweets. The methods we have described for studying correlation can also be applied to other social media corpora, such as Reddit or Wikipedia comments. We believe that our results can encourage the exploration of additional meta-data-based features
for complementing text-based sentiment analysis research of social media data, and the creation of standard datasets that capture these effects in detail. Finally, our results matter for the advancement of social media analytics: knowing expected tweet sentiments based on user-level meta-data enables a) the detection of outlier tweets, which may signal special relevance of individual data points, and b) the calibration of individual users within samples of multiple users. The second point can help to address a major issue with sampling biases for social media data, i.e., the normalization of individual users who have unexpectedly high or low sentiments in comparison to their user-level features. In classic survey research, identifying individual tendencies for responding in an overly positive or negative way is of high relevance, and such work can inform social media research. This paper offers a remedy for starting to fix this need. Finally, we provide code that can be used for reproducing the results along with supplementary analysis.
ACKNOWLEDGMENTS
This work was possible thanks to a Microsoft Azure Research Sponsorship awarded to the Shubhanshu Mishra. The views expressed in this paper are those of the authors. We would also like to thank Shadi Rezapour, Aseel Addawood, Ming Jiang, Chieh-Li Chin, and Ly Dinh from the iSchool at UIUC for their constructive feedback on this paper. We also thank the three anonymous reviewers for their feedback.
REFERENCES
[1] Ahmed Abbasi, Ammar Hassan, and Milan Dhar. 2014. Benchmarking Twitter
Sentiment Analysis Tools. In Proceedings of the Ninth International Conference on Language Resources and Evaluation (LREC’14). European Language Resources Association (ELRA), Reykjavik, Iceland. http://www.aclweb.org/anthology/ L14-1406 [2] Sitaram Asur and Bernardo A. Huberman. 2010. Predicting the Future with Social
Media. In 2010 IEEE/WIC/ACM International Conference on Web Intelligence and Intelligent Agent Technology. IEEE, Toronto, Canada. https://doi.org/10.1109/ wi-iat.2010.63
Session 1: Computational Social Science HUMAN’18, July 9, 2018, Baltimore, MD, USA
[3] Johan Bollen, Huina Mao, and Alberto Pepe. 2011. Modeling Public Mood and
Emotion: Twitter Sentiment and Socio-Economic Phenomena. In Proceedings of the Fifth International AAAI Conference on Weblogs and Social Media (ICWSM ’11). AAAI, Barcelona, Spain. https://www.aaai.org/ocs/index.php/ICWSM/ ICWSM11/paper/view/2826 [4] Rui Fan, Jichang Zhao, Yan Chen, and Ke Xu. 2014. Anger Is More Influential
than Joy: Sentiment Correlation in Weibo. PLOS ONE 9, 10 (10 2014), 1–8. https: //doi.org/10.1371/journal.pone.0110184 [5] W. Gao and F. Sebastiani. 2015. Tweet sentiment: From classification to quan-
tification. In 2015 IEEE/ACM International Conference on Advances in Social Networks Analysis and Mining (ASONAM ’15). IEEE, Paris, France, 97–104. https://doi.org/10.1145/2808797.2809327 [6] Alec Go, Richa Bhayani, and Lei Huang. 2009. Twitter Sentiment Classification using Distant Supervision. (2009). https://www.semanticscholar. org/paper/Twitter-Sentiment-Classification-using-Distant-Go-Bhayani/ 52e2bd533323ddf97073d034bae40a46eda55f34 [7] C. Hutto and Eric Gilbert. 2014. VADER: A Parsimonious Rule-Based Model for
Sentiment Analysis of Social Media Text. In Proceedings of the Eight International AAAI Conference on Weblogs and Social Media (ICWSM ’14). AAAI, Ann Arbor, Michigan, USA. https://www.aaai.org/ocs/index.php/ICWSM/ICWSM14/paper/ view/8109 [8] Yoon Kim. 2014. Convolutional Neural Networks for Sentence Classification.
In Proceedings of the 2014 Conference on Empirical Methods in Natural Language Processing (EMNLP ’14). Association for Computational Linguistics, Doha, Qatar, 1746–1751. https://doi.org/10.3115/v1/D14-1181 [9] Richard A Leibler and S Kullback. 1951. On information and sufficiency. Annals
of Mathematical Statistics 22, 1 (1951), 79–86. [10] Bing Liu. 2011. Opinion Mining and Sentiment Analysis. Springer-Verlag Berlin Heidelberg, Berlin, Heidelberg. 459–526 pages. https://doi.org/10.1007/ 978-3-642-19460-311 [11] M. M. Masud, Q. Chen, L. Khan, C. Aggarwal, J. Gao, J. Han, and B. Thuraisingham.
Addressing Concept-Evolution in Concept-Drifting Data Streams. In 2010 IEEE International Conference on Data Mining. 929–934. https://doi.org/10.1109/ ICDM.2010.160 [12] Shubhanshu Mishra, Sneha Agarwal, Jinlong Guo, Kirstin Phelps, Johna Picco, and
Jana Diesner. 2014. Enthusiasm and support: alternative sentiment classification for social movements on social media. In Proceedings of the 2014 ACM conference on WebScience (WebSci ’14). ACM Press, Bloomington, Indiana, USA, 261–262. https://doi.org/10.1145/2615569.2615667 [13] Shubhanshu Mishra, Jana Diesner, Jason Byrne, and Elizabeth Surbeck. 2015.
Sentiment Analysis with Incremental Human-in-the-Loop Learning and Lexical Resource Customization. In Proceedings of the 26th ACM Conference on Hypertext & Social Media (HT ’15). Guzelyurt, TRNC, Cyprus, 323–325. https://doi.org/ 10.1145/2700171.2791022 [14] Igor Mozetič, Miha Grčar, and Jasmina Smailović. 2016. Multilingual Twitter
Sentiment Classification: The Role of Human Annotators. PLOS ONE 11, 5 (05 2016), 1–26. https://doi.org/10.1371/journal.pone.0155036 [15] Preslav Nakov, Alan Ritter, Sara Rosenthal, Fabrizio Sebastiani, and Veselin
Stoyanov. 2016. SemEval-2016 Task 4: Sentiment Analysis in Twitter. In Proceedings of the Tenth International Workshop on Semantic Evaluation (SemEval ’16). Association for Computational Linguistics, Stroudsburg, PA, USA, 1–18.
https://doi.org/10.18653/v1/S16-1001
[16] Preslav Nakov, Sara Rosenthal, Svetlana Kiritchenko, Saif M. Mohammad, Zor-
nitsa Kozareva, Alan Ritter, Veselin Stoyanov, and Xiaodan Zhu. 2016. Developing a successful SemEval task in sentiment analysis of Twitter and other social media texts. Language Resources and Evaluation 50, 1 (jan 2016), 35–65. https://doi.org/10.1007/s10579-015-9328-1 [17] Preslav Nakov, Sara Rosenthal, Zornitsa Kozareva, Veselin Stoyanov, Alan Ritter,
and Theresa Wilson. 2013. SemEval-2013 Task 2: Sentiment Analysis in Twitter. In Proceedings of the Seventh International Workshop on Semantic Evaluation (SemEval’13). Association for Computational Linguistics, Atlanta, Georgia, USA, 312–320. http://www.aclweb.org/anthology/S13-2052 [18] Preslav Nakov, Sara Rosenthal, Zornitsa Kozareva, Veselin Stoyanov, Alan Ritter,
and Theresa Wilson. 2013. SemEval-2013 Task 2: Sentiment Analysis in Twitter. In Second Joint Conference on Lexical and Computational Semantics (SEM), Volume 2: Proceedings of the Seventh International Workshop on Semantic Evaluation (SemEval ’13). Association for Computational Linguistics, Atlanta, Georgia, USA, 312–320. http://www.aclweb.org/anthology/S13-2052 [19] Alexander Pak and Patrick Paroubek. 2010. Twitter as a Corpus for Sentiment
Analysis and Opinion Mining. In Proceedings of the Seventh conference on International Language Resources and Evaluation (LREC’10). European Languages Resources Association (ELRA), Valletta, Malta. http://www.aclweb.org/anthology/ L10-1263 [20] Bo Pang and Lillian Lee. 2008. Opinion Mining and Sentiment Analysis. Found.
Trends Inf. Retr. 2, 1-2 (Jan. 2008), 1–135. https://doi.org/10.1561/1500000011 [21] Bo Pang, Lillian Lee, and Shivakumar Vaithyanathan. 2002. Thumbs up? Senti-
ment Classification using Machine Learning Techniques. In Proceedings of the 2002 Conference on Empirical Methods in Natural Language Processing (EMNLP ’02). Philadelphia, PA, USA. [22] Sara Rosenthal, Preslav Nakov, Svetlana Kiritchenko, Saif Mohammad, Alan
Ritter, and Veselin Stoyanov. 2015. SemEval-2015 Task 10: Sentiment Analysis in Twitter. In Proceedings of the 9th International Workshop on Semantic Evaluation (SemEval ’15). Association for Computational Linguistics, Denver, Colorado, USA, 451–463. https://doi.org/10.18653/v1/S15-2078 [23] Richard Socher, Alex Perelygin, Jean Wu, Jason Chuang, Christopher D. Man-
ning, Andrew Ng, and Christopher Potts. 2013. Recursive Deep Models for Semantic Compositionality Over a Sentiment Treebank. In Proceedings of the 2013 Conference on Empirical Methods in Natural Language Processing (EMNLP ’13). Association for Computational Linguistics, Seattle, Washington, USA, 1631–1642. http://www.aclweb.org/anthology/D13-1170 [24] Chenhao Tan, Lillian Lee, Jie Tang, Long Jiang, Ming Zhou, and Ping Li. 2011.
User-level Sentiment Analysis Incorporating Social Networks. In Proceedings of the 17th ACM SIGKDD International Conference on Knowledge Discovery and Data Mining (KDD ’11) (KDD ’11). ACM, San Diego, California, USA, 1397–1405. https://doi.org/10.1145/2020408.2020614 [25] Andranik Tumasjan, Timm Sprenger, Philipp Sandner, and Isabell Welpe. 2010.
Predicting Elections with Twitter: What 140 Characters Reveal about Political Sentiment. In Proceedings of the Fourth International AAAI Conference on Weblogs and Social Media (ICWSM ’10). AAAI, Washington, DC, USA. https://www.aaai. org/ocs/index.php/ICWSM/ICWSM10/paper/view/1441 [26] Soroush Vosoughi, Helen Zhou, and deb roy. 2015. Enhanced Twitter Sentiment
Classification Using Contextual Information. In Proceedings of the 6th Workshop on Computational Approaches to Subjectivity, Sentiment and Social Media Analysis. Association for Computational Linguistics, Lisboa, Portugal, 16–24. https://doi. org/10.18653/v1/W15-2904
Source facsimiles for figures, tables, and equations
The following native-image page facsimiles preserve the source rendering for each identified figure, table, and equation.
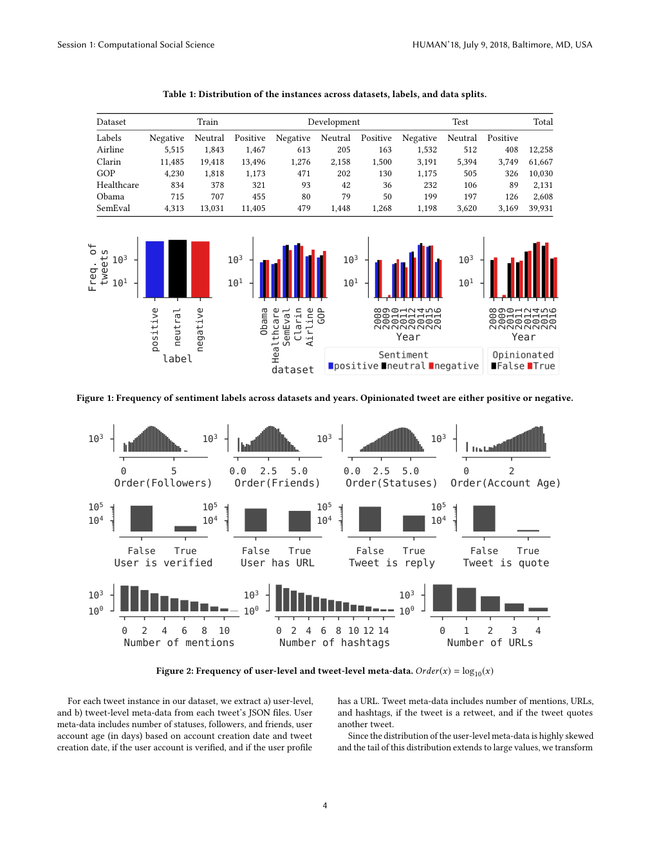
Figure 1: Frequency of sentiment labels across datasets and years. Opinionated tweet are either positive or negative.
Figure 2: Frequency of user-level and tweet-level meta-data. Order(x) = log10(x)
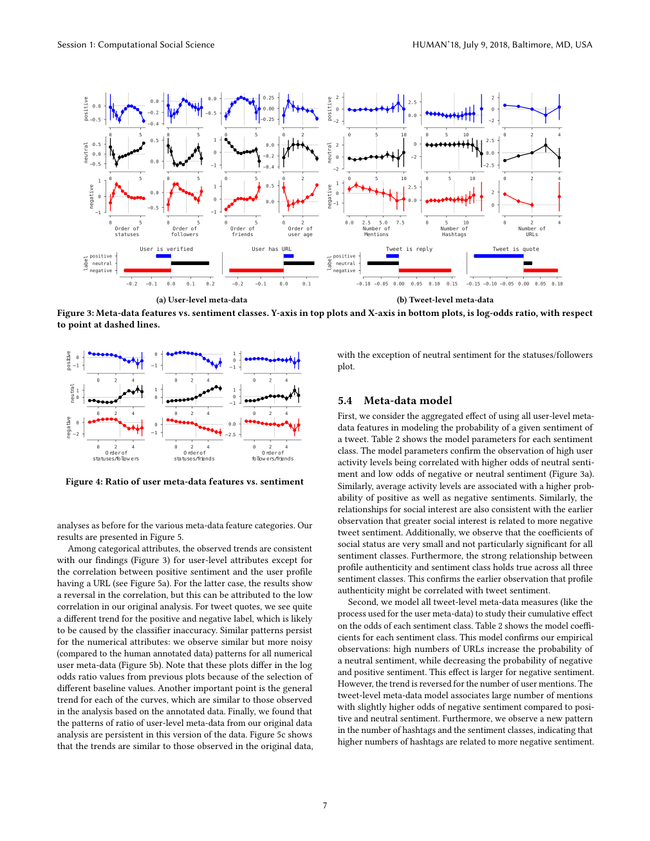
Figure 3: Meta-data features vs. sentiment classes. Y-axis in top plots and X-axis in bottom plots, is log-odds ratio, with respect
Figure 4: Ratio of user meta-data features vs. sentiment
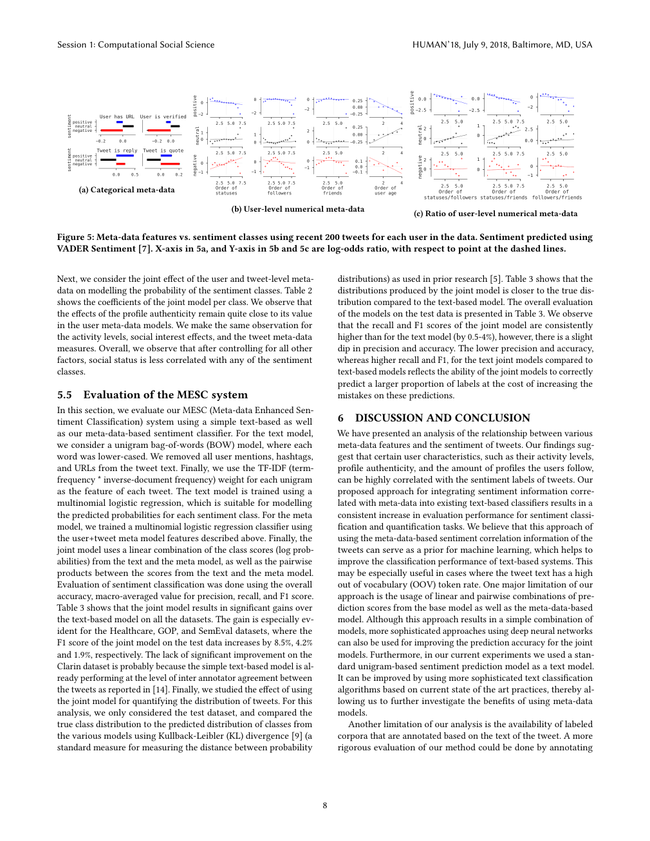
Figure 5: Meta-data features vs. sentiment classes using recent 200 tweets for each user in the data. Sentiment predicted using
Table 1: Distribution of the instances across datasets, labels, and data splits.
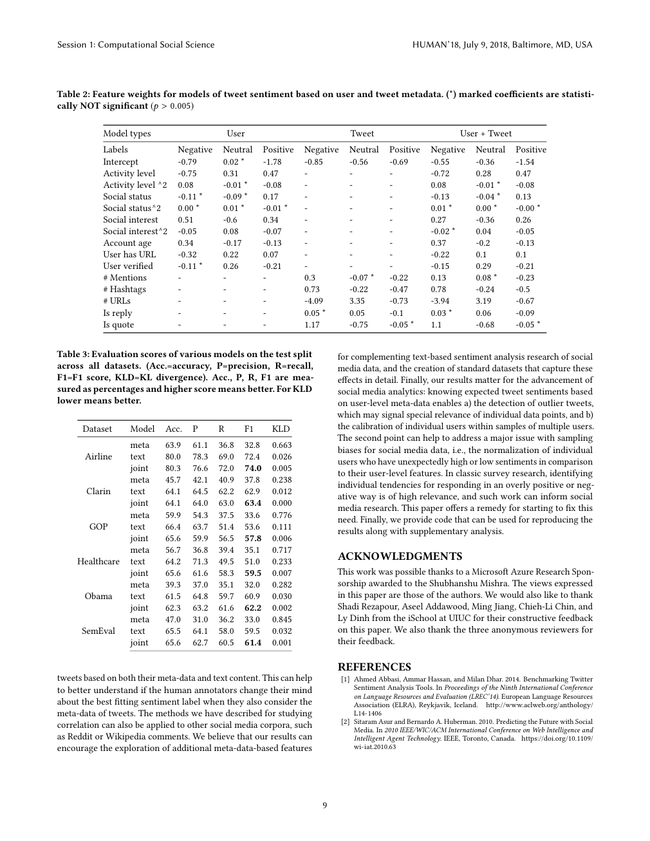
Table 2: Feature weights for models of tweet sentiment based on user and tweet metadata. () marked coefficients are statisti-
Table 3: Evaluation scores of various models on the test split
Equation source facsimile, page 3.
Equation source facsimile, page 4.
Complete source-page facsimiles
The following native IPFS images retain the complete original pages for visual verification.
Source PDF page 1.
Source PDF page 2.
Source PDF page 3.
Source PDF page 4.
Source PDF page 5.
Source PDF page 6.
Source PDF page 7.
Source PDF page 8.
Source PDF page 9.
Do you like what you are reading? Subscribe to receive updates.
Unsubscribe anytime