

Studying the Spatio-Temporal Dynamics of Small-Scale Events in Twitter
Authors: Paul Mousset, Yoann Pitarch, and Lynda Tamine
Studying the Spatio-Temporal Dynamics
of Small-Scale Events in Twitter
Yoann Pitarch IRIT, Université de Toulouse, CNRS
Toulouse, France
pitarch@irit.fr
ABSTRACT
Small-scale events are emerging as attractive objects of research. On Twitter, small-scale events represent weak sensors that report things happening in specific times and places. While previous work addressed the issue of detecting such events, very little is known so far about their inherent properties. In this paper, our main objective was to analyse the spatio-temporal peculiarities of small-scale events w.r.t different levels of location granularity, and to understand the general trend of their propagation along their lifetimes. Our findings suggest that (1) users involved in small-scale events mostly gravitate not significantly far from the geographical focus; (2) events do not exhibit major peaks; and (3) there exists distinct events that we can identify from users’ posts that significantly differ from topic distribution, focus concentration and propagation distance perspectives across time.
CCS CONCEPTS
• Computer systems organization →Embedded systems; Redundancy; Robotics; • Networks →Network reliability;
KEYWORDS
Small-scale event; geo-tagged tweets; focus; entropy
ACM Reference Format: Paul Mousset, Yoann Pitarch, and Lynda Tamine. 2018. Studying the Spatio- Temporal Dynamics of Small-Scale Events in Twitter. In HT ’18: 29th ACM
Conference on Hypertext and Social Media, July 9–12, 2018, Baltimore, MD, USA. ACM, New York, NY, USA, 9 pages. https://doi.org/10.1145/3209542. 3209561
1 INTRODUCTION
Microblogging platforms such as Twitter provide active communication channels and a gold-mine of timely real-world information which has been shown to be highly effective for gaining knowledge about people’s profiles [22], and opinions [16] to cite just a few. In particular, for events such as festivals, political campaigns, pandemics and crisis situations, user-generated micro-posts play a crucial role as social sensors by allowing the monitoring of users’ activities and the provision of timely responses and
Permission to make digital or hard copies of all or part of this work for personal or classroom use is granted without fee provided that copies are not made or distributed for profit or commercial advantage and that copies bear this notice and the full citation on the first page. Copyrights for components of this work owned by others than ACM must be honored. Abstracting with credit is permitted. To copy otherwise, or republish, to post on servers or to redistribute to lists, requires prior specific permission and/or a fee. Request permissions from permissions@acm.org. HT ’18, July 9–12, 2018, Baltimore, MD, USA © 2018 Association for Computing Machinery. ACM ISBN 978-1-4503-5427-1/18/07...$15.00 https://doi.org/10.1145/3209542.3209561
recommendations [12]. More specifically, event-related tweet streams provide valuable spatio-temporal data such as text messages with location mentions, the timestamp of the post and the geolocation of the user who posted the tweet. With the increasing connectivity of users through wireless networks and the wide use of mobile devices, geo-tagged tweets are currently created daily. This phenomena allowed the intensive use of Twitter data for detecting and monitoring both large-scale events (eg., earthquakes and epidemics) and small-scale events (eg., festivals, crimes and protests). An important body of early research focused on detecting, analysing and mining behavioural patterns from large-scale events (also called global events), which are bursty in the entire stream, impact a wide spatial area and trigger an important audience [6, 23]. Recently, there has been a growing research interest in detecting [1, 26, 30–32] and analysing [24, 25, 30] small-scale events. Unlike large-scale events, small-scale events (also called local or localized events) are generally micro-phenomena that stimulate people to post a low number of messages for a certain period of time in a local region. Such events play the roles of weak signals which have potential in several applications such as public order protection and traffic road assistance. However, the literature review reveals that very little has been understood so far about the spatio-temporal dynamics of such events [24, 25, 30]. A prior study [30] focused on the analysis of user physical network structure during two micro-events, namely a parking garage collapse in Atlanta and a church shooting in Wichita. The results mainly revealed that the event-related structure of the networks is not particularly more dense than the Twitter network structure and that central Twitterers are geographically central particularly in more spatially narrowed events. In [24, 25], authors examined the users’ posts during two incidents which refer to small-scale events that result in damage or injuries. The authors found that different types of users (eg., journalists, organisation and citizens) report on the incidents and that citizens are generally faster than official sources in propagating tweet posts.
In this paper we pursue this line of research and report the findings of analyses that are designed to investigate the spatio-temporal dynamics of small-scale events. By using the focus and entropy measures, we thoroughly study the spatial and timely tweet post distributions of such events based on a wide set of event types automatically identified in geo-tagged tweet streams. Moreover, we consider locations at varying levels of granularity, from the borough to the Point Of Interest (POI) level. The key differences between close previous work [24, 25, 30] and ours are the following: (1) previous work focused on the analysis and comparison of network structure in the Twitter network vs. event-related network [30] and
the identification of user types involved in the event [24, 25]. Moreover, the studies used limited samples of prior specific events (eg., incidents) in terms of number of tweets (655 event-related tweets used in [24, 25]), as well as number of events (2 events studied in [30]). In contrast, we deeply analyse the spatial narrowness of users involved in the events and study the propagation trend of their posts w.r.t varying levels of location; furthermore, our study relies on a significant number of event-related tweets (22832) as well as a significant number of events (410) belonging to a set of event types automatically identified from the users’ posts. (2) We also examine the spatio-temporal evolution of small-scale events along their lifetime while the temporal dimension has not been addressed in previous work [24, 25, 30]. More specifically, our study is mainly designed for answering the following general questions: What is a rough estimate of the geographical impact of small-scale events in terms of situationalawarness among users? How do small-scale events evolve in time and space? Answering to these questions has many potential applications in improving the designing of better web tracking and searching services and helping both organisation and citizen better fulfill their information needs. For example, modelling the timely propagation of small-scale events from their center of gravity enables the development of more robust user’s location estimators over time which can be useful for fine-grained location-based personalized information services [10] and designing more effective monitoring services allowing to better plan social events and offer user facilities [3]. A better understanding of their evolving spatio-temporal dispersion enables richer retrieval models answering location-based queries (eg., What is happening at specific location X?) that could improve the spatial extent of users’ awarness during crisis situations. The analyses performed in our work directly address the following research questions:
RQ1: What is the level of users’ narrowness while posting small-scale event-related tweets? RQ2: How do location and time bound tweet propagation during small-scale events? RQ3: Can we identify and characterize event types with the tweet publications collected from users? The remainder of this paper is organized as follows: Section 2 presents the related work. We detail the data and methods that are used in our analyses in Section 3. In Section 4, we report the findings of our study w.r.t the aforementioned research questions. We discuss the implications of our findings and conclude in Section 5.
2 RELATED WORK 2.1 Large-scale vs. small-scale event detection
To the best of our knowledge, there is no consensual definition of an ’event’ [20, 24]. One widely used definition has been introduced by the Topic Detection and Tracking (TDT) project which defines an event as ’an unique thing that happens at some point in time’ [13]. The main common facets of an event are time, place and audience as introduced by authors in [7] who define an event as a real-world occurrence with an associated time period, time-ordered messages discussing the occurrence during a period of time. According to spatial and social impacts, we can distinguish between large-scale events such as earthquakes and epidemics (also called global events)
and small-scale events such as crims, protests and festivals (also called incidents, local or localized events). While the former give rise to massive user-generated content and impact a wide spatial region, the latter lead to the posting of a low amount of content within a small region. A number of early research work have investigated global event detection in Twitter [6, 23]. Related approaches fall in the documentbased and feature-based categories. The key idea of document-based approaches relies on the association between document cluster based on a shared topic and the notion of event [2]. For instance, authors in [2] built events as clusters based on content similarity and user proximity. In feature-based approaches [11], the event detection algorithm rather relies on bursty features such as keywords and phrases. Such burstiness is captured as event signal wich is filtered and transformed (eg., using time-series) to identify events. The high connectivity of users through wireless networks and the wide availability of geo-tagged tweets nowadays gave rise to a recent emerging interest toward small-scale event detection which is particularly challenging given the low amount of induced posts [1, 26, 32]. The driving idea behind small-scale event detection algorithms is to identify joint geo-spatial and topical correlations in Twitter streams. The main underlying assumption is that, topical cohesion of even limited samples of tweets posted in a narrow geographical space, is a weak signal of event occurrence. Based on this general assumption, authors in [1] proposed the EvenTweet algorithm which detects small-scale events by running four main stages: (1) determining time windows of bursty words; (2) identifying localized words by computing spatial entropy; (3) spatial clustering of localized words; and (4) associating each cluster with an event and then ranking events according to spatial coverage and burstiness measures. In the same spirit, the GeoBurst algorithm [32] relies on three main steps to detect small-scale events: (1) identifies representative tweets (called pivots) and associated geo-topic correlated tweets in slicing time windows; (2) compares the clusters of tweets to historical streaming tweets to identify bursty clusters of tweets among the candidate ones identified in the first stage; and (3) further identifies new pivots in successive windows.
2.2 Analysing spatio-temporal Twitter data
The prevalence of social media services such as Facebook and Twitter and the increasing use of mobile devices, have enabled the availability of a powerful source of streamed user-generated content about location and regional human behaviour. This motivates the spatio-temporal analysis of social media data for various purposes such as crisis management [21] and future prediction [5]. On Twitter, the literature review reveals that a large body of studies investigated the analysis of spatio-temporal metadata for different purposes [4, 14, 18, 27]. A first category of work have analysed the spatio-temporal properties of tweets to better understand their diffusion [4, 14] or discover spatio-temporal dependent topics that are addressed by Twitter users. For example, in [14], the authors mainly observed the joint phenomena of the high-locality of hashtags and their high-speed propagation over time. Another category of work have used spatio-temporal data from Twitter to design web services such as automatic summarizers [19] or monitoring systems [3]. For instance, in [19], the authors developed an event summarizer called CEST that exploits Twitter
geographical metadata mainly including POI. Once the event is detected, the CEST system provides a high-level picture of the spatial extent of the event as well as the distribution of positive vs. negative opinions embedded in the event-related tweets. An other important category of work focused on mining from largescale or small-scale events. Early work studied large-scale events through the examination of the regional trends and temporal patterns of users’ behaviour to address medical concerns [18] or better manage emergency situations [27]. Lee et al. [18] designed a surveillance system for early prediction of seasonal disease outbreaks such as flu. Using tweet analytics about the timeline and geographical distribution of disease symptoms, the system can facilitate the monitoring of health resource allocation during epidemics. In [27], the authors analysed users’ micro-posts across two disaster events that took place in the US: the Red River Floods and the Oklahoma Grassfires. They outlined that unlike in the overall tweet stream, there were a high proportion (more than 78%) of both geo-tagged tweets and location mentions in tweet texts during natural disasters which suggests that users are aware of the importance of geo-location information in collaboratively managing an emergency. Moreover, the analysis of the event time-line showed a clear picture of the spread of situational awareness among Twitterers. Other work, more close to ours focused on small-scale events, also called incidents in the specific case where they induce damage and injuries [24, 25, 30]. Their analysis mainly concerned the study of the impact of such events on the network structure [30] and the categorisation of user profiles (eg., organization, citizen) according to predefined event types such as crash and fire [24, 25]. The findings revealed that influencial users kept their roles in event-related networks [30] and that citizen were more importantly involved than officials in the event spread [24, 25].
3 STUDY DESIGN 3.1 Data
3.1.1 Twitter datasets. We analysed two collections of geotagged tweets related to New York City, and restricted our study to English-language tweets. The geotag provides latitude-longitude coordinates about the physical location of the associated Twitter user. To facilitate the analysis of multiple levels of location granularity, we used the latitude-longitude coordinates and mapped them to the borough and neighbourhood and to the most likely Place Of Interest (POI). To perform this mapping, we used a recent state-of-the art POI annotation method that relies on geo-tagged tweets [33]. We have particularly choosen New York City as the main location for a couple of reasons: (1) given the high number and the diversity of event types that might occur in New York; (2) the availability of rich resources that provide POI descriptions in New York City. The characteristics of the datasets are the following.
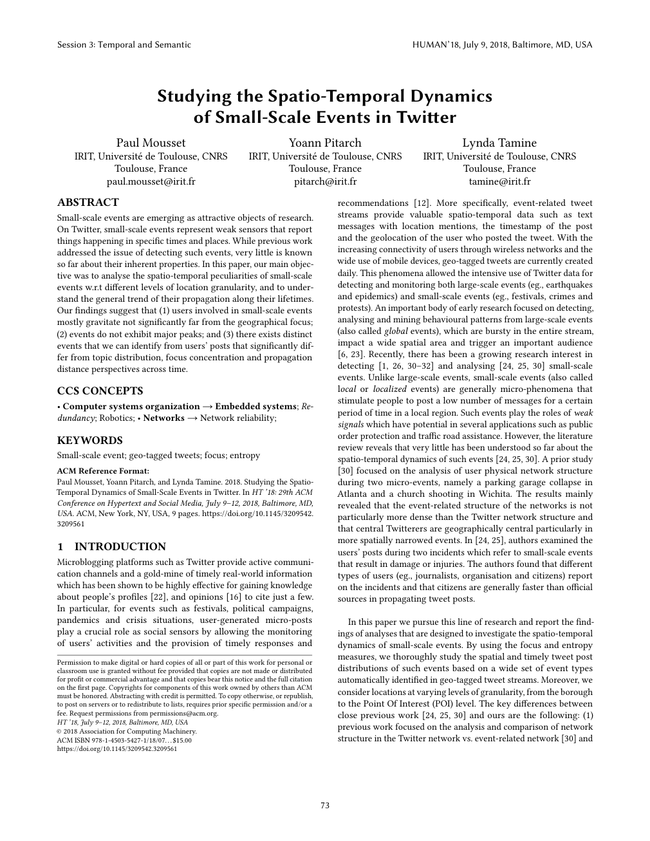
• The first dataset, which is referred to as NY2014, was released by Zhang et al. [32]. It consists of a sample of 2.4 million of tweets that were geo-tagged in New York and retrieved using the Twitter Streaming API1 from 2014.08.01 to 2014.11.30. • The second dataset was obtained by constantly monitoring the Twitter streams from 2016.06.18 to 2016.12.08 for 116
1https://developer.twitter.com/
cities around the world, which included more than 65 million geo-tagged tweets. For this study, we extracted a sub-dataset, which is referred to as NY2016, that contains only geo-tagged tweets published in New York from 2016.10.01 to 2016.11.30. It contains approximately 2.98 million tweets.
3.1.2 Event labelling. The process of building a pool of smallscale events from the two datasets consisted in a 2-step task:
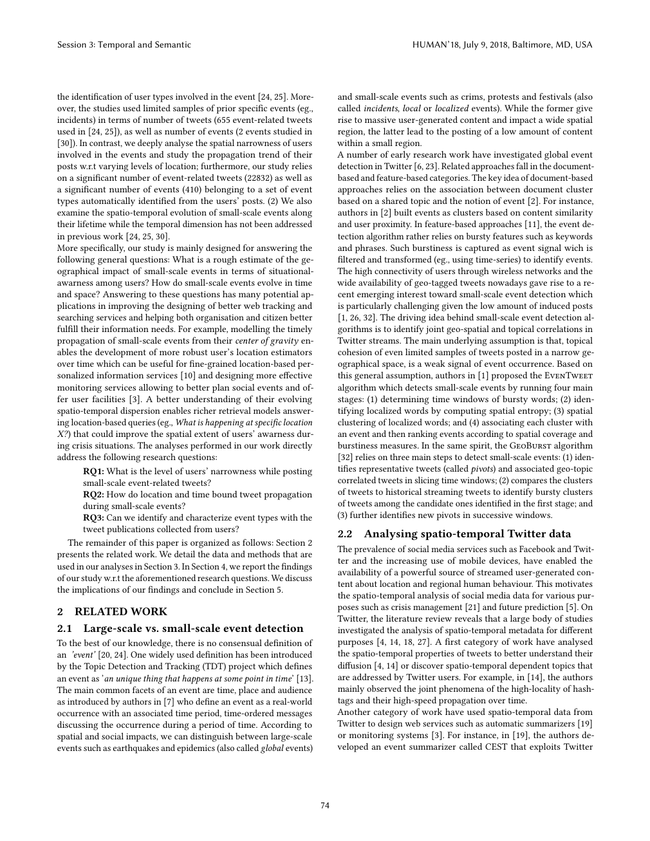
• Step 1: Generating candidate small-scale events. The objective of this step was to extract from the Twitter datasets clusters of representative event-related tweets. To achieve this objective without bias induced by the event detection algorithm, we used two state-of-the art event detection algorithms, namely the EvenTweet [1] and GeoBurst algorithms [32]. In addition to our confidence in their effectiveness and efficiency, the main advantage of these algorithms is that they provide clusters of tweets and/or authoritative words that facilitate further human annotation. The generation of candidate small-scale events was run as follows: (1) Apply separately each of the EvenTweet and GeoBurst
algorithm on each dataset, namely the NY2014 and NY2016 datasets. More specifically: (i) we ran the GeoBurst algorithm using very similar parameters to those used by Zhang et al. [32]. More precisely, the kernel bandwith h = 0.01, the ranking parameter for balancing spatial and temporal burstiness η = 0.5 and the RWR similarity threshold δ = 0.01 with sliding time windows of 6 hours, including 3 hours of overlapping time. (ii) we ran the EvenTweet algorithm based on the partitioning of the whole space into NxN small grids with N = 50. At the end of this stage we obtained a pair of ranked lists of word clusters for each dataset. (2) With respect to our goal which consists in avoiding
the bias induced by the event detection algorithm on the spatio-temporal properties of the tweets, we only selected a subset of common events that were detected by both algorithms as relevant candidate events. Instead of applying exact matching which is highly unlikely given the difference in the techniques used by the GeoBurst and EvenTweet algorithms for tweet clustering, we applied an approximate matching based on a clustering similarity constrained by a threshold: the Szymkiewicz-Simpson overlap coefficient with a threshold set up to 0.5. This first step resulted in 1163 and 1802 event clusters for the NY2014 and NY2016 datasets respectively.
• Step 2: Building the ground truth event datasets. In the previous step we obtained a set of candidate small-scale events. However, given that the precision of each of the GeoBurst and EvenTweet is less than 100%, human annotation was required to build the gold dataset. To this end, we set up a crowdsourced annotation tasks using CrowdFlower2, which is a popular crowdsourcing platform. The objective of this task was to build the gold set of small-scale events from the candidate events which were represented as clusters of
2http://www.crowdflower.com/
Table 1: Descriptive statistics of the NY2014 and NY2016 datasets.
NY2014 NY2016
small-scale events 278 132
Metlife Stadium Yankee Stadium Barclays Center
Trump Tower avits Center Shuttle Barclays Center Average duration 5h45 5h43 Duration standard deviation 2h25 2h24
Top 3 POIs
authoritative tweets from the previous step. For this aim, we provided the crowdworkers with clusters of the 5 tweets with the highest authority scores and with the 10 most representative keywords. We asked them to judge whether each set of tweets corresponds to an event, and, if so, to judge whether it is a small-scale event. For the latter judgement, crowdworkers were instructed to follow the definition of a small-scale event that is given in [33] (called local event): "a local event is a specific thing that occurs at a specific time and restricted to a narrow area (e.g., protest march, house fire, traffic jam"). To ensure reliable task outcomes, we submitted the tasks to experienced crowdworkers with a high level of performance (Level = 3). The performance was assessed by the platform using an average measure of the correctness of their answers to the test questions over all the tasks they have performed. For additional quality control, for each task, we included predefined question-answer pairs as the gold standard. Only crowdworkers who achieved no less than 80% on the ground truth were finally recruited. Moreover, since it is likely that different workers have different levels of agreements, we assigned each task to 3 workers. The majority voting strategy was used to generate the final answer. We offered a payment of $0.05 per respondent for completing the survey. At this stage, the gold set3 for the NY2014 dataset (resp. the NY2016 dataset) consists of 378 (resp. 219) events including 278 small-scale events (resp. 132). More detailed statistics of the datasets are given in Table 1. Since the two datasets have similar values of both average duration and standard deviation, we pooled them into one dataset. Table 2 provides further statistics about a sample of human-annotated events.
3.2 Metrics
We detail below the metrics that were used in our study (which are similar to those used for analysing the geographic characteristics of YouTube videos [9]). It is worth to mention that the datasets contain geo-tagged tweets which provide spatial location of the Twitter users. Accordingly, tweet location mentioned below also refers to the location of the user who posted the tweet.
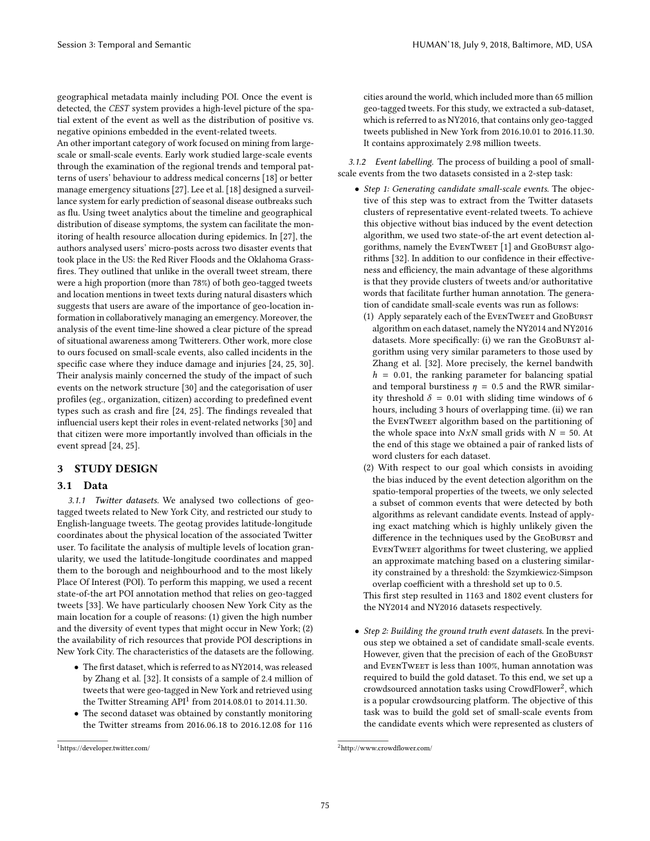
3.2.1 Geographical focus. Focus is concerned with how narrow the geographical space the event tweets deal with. For each event e and each location l ∈L, we define the geographic focus, as the maximal probability of observing a tweet that is posted from or
3Dataset is available at https://doi.org/10.6084/m9.figshare.c.4089605
Table 2: A sample of small-scale events identified in the pooled dataset.
Event Dataset Duration # Tweets
NY Thanksgiving Parade NY2014 17h30 723 Box fight (WWE) NY2014 14h30 151 Hockey match NY2016 5h16 28 Billy Joel concert NY2016 3h27 10
discusses about a single location l.
e = | T le |
Fe = max
l ∈L pl
e ; pl
T e | (1) |
whereT l is the set of tweet events that are geo-tagged at location l, T e is the set of tweets related to event e and T le is the subset of event tweets that are related to event e and geo-tagged at location l. The geographic focus inherently decreases with the propagation of the tweets that deal with event e. It is worth noting that an event for which the entire set of tweets are posted from the same location has a focus of 1.0. We can also measure the geographical focus over a time interval t, denoted as Fe(t).
3.2.2 Event entropy. The entropy is concerned with how diverse the entire spatial distribution of the event is. The higher the entropy is, the more diverse the range of locations that are covered by the event. For instance, an event for which the entire set of tweets are posted from the single location has an entropy of 0.0. More generally, an event entropy value of He indicates that the event propagated almost evenly to 2H e locations.
He = −
Õ
pl
e loд2 pl
e (2)
l ∈L
Similar to the focus, we can measure the event entropy over a time interval t, denoted He(t).
4 FINDINGS 4.1 Spatial coverage of users (RQ1)
Our objective here is to analyse the extent to which small-scale events have a meaningful geographical focus and how they propagate spatially w.r.t the different levels of spatial granularity: borough, neighbourhood and POI. To achieve this objective, we compute for each event the focus value Fe at each level. Figure 1(a) shows the related cumulative distributions (CDF) of focus values. By observing the two coarsest levels, namely, neighbourhood and borough, we conjecture that the users involved in the events are almost all restricted to the same borough and to very few neighbourhoods. Indeed, for 97% of events, at least 90% of the tweets are posted from the same borough (Fe ≥0.90), and for half (49%) of the events, at least 90% of the tweets originate from a single neighbourhood (Fe ≥0.90). However, at the POI level, tweets are more diffuse. Only 70% of events have at least half of their tweets posted from a single POI (Fe ≥0.50); more generally, with the distribution being nearly linear, the focus values seem to be uniformly distributed.
1.0
1.0
POI Neighbourhood Borough
0.8
0.8
0.6
0.6
CDF
CDF
0.4
0.4
0.2
0.2
0.0
0.0
1.0
0.8
0.6
CDF
0.4
POI Neighbourhood Borough
0.2
Focus - Users Users - Users
0.0
0 1 2 3 4 Average distance (km)
0 1 2 3 4 5 6 7 Event entropy
0.0 0.2 0.4 0.6 0.8 1.0 Event focus
(b) Event entropy H e
(c) Event average distance
Figure 1: Cumulative Distribution Function (CDF) of event focus, entropy and average distance.
1.0
1.0
0.8
0.8
Event focus
Event focus
0.6
0.6
0.4
0.4
0.2
0.2
0.0
0.0
0 1 2 3 4 5 6 7 Event entropy
6
5
Event entropy
4
3
2
1
0
0.0 0.5 1.0 1.5 2.0 Event distance
0.0 0.5 1.0 1.5 2.0 Event distance
(b) Focus versus Distance
Figure 2: Correlation between Focus, Entropy and Distance at POI level.
Beyond the focus, we analyse the event propagation across locations. To do so, we examine the event entropy values, He, which are plotted in Figure 1(b). As can be observed, events are mostly limited to a single neighbourhood (75%) or borough (99%). At the POI level, approximately 42% of the events mainly involve a single POI (He < 1). Thus, the majority of small-scale events (53%) involves from 2 to 16 POIs, (1 ≤He ≤4). This observation confirms our previous result about the spatial narrowness of the users.
So far, we used focus and entropy metrics to provide insights into event epicentres and propagation trends. However, no clues are provided about the geographic area over which events propagate. To fill this gap, we compute for each event both the user-user distance and the user-focus distance using the standard Haversine distance tailored for longitude-latitude coordinates4. Figure 1(c) reports the cumulative distribution of the average distance values w.r.t user-user distance (dashed line) and focus-user distance (solid line). Looking at the user-user average distances, we can see that 80% of the events have an average distance of less than 500 metres. Thus, users’ locations are mostly very close to one another which confirms the narrowness of the influence areas of small-scale events. From the examination of the focus-user distance values, we can note that 88.3% of tweets are posted less than 500 metres from the focus, and only 4.85% are posted from more than 1,000 metres away. To sum up, the further away from the focus users are, the fewer
4http://www.movable-type.co.uk/scripts/latlong.html
posted tweets there are. This suggests that most of users who post event tweets gravitate around the geographical focus.
We finally analyse the potential relationships between the event geographical influence which is represented by the focus, the event propagation, which is represented by the entropy and the spatial proximity of users, represented by the distance. Building on previous results that indicated that event dispersion over POI is more important, we plotted the correlations between those measures w.r.t POI. Figure 2 reports the pairwise correlations between these metrics which were computed using the Pearson coefficient. Figure 2(a) shows a strong negative correlation (-0.92) between entropy and focus as can be expected from the previous observations about the narrowness of the event-related area around the focus. Turning our attention to the correlations between focus and distance (Figure 2(b)) and between entropy and distance (Figure 2(c)), we note that when the distance between users increases, the intensity of the focus decreases, which leads to a negative correlation (-0.64), and the entropy increases, which leads to a positive correlation (0.69). In summary, the more scattered an event is, the less the users concentrate around a single POI, and the more tweets are propagated over several locations. 4.2 Spatio-temporal dynamic trends (RQ2)
Here, we cross the spatial and temporal perspectives with the aim of investigating the evolving spatial properties of events across their lifetimes. Our practical objective is to provide some insights into how quickly and how long small-scale events propagate. To achieve
Table 3: Ratio of events w.r.t their duration.
Duration Percentage
0 – 3 h 6.59% 3 – 6 h 66.83% 6 – 9 h 20.00% 9 + h 6.58%
0.35
0.30
0.25
% of peaks
0.20
0.15
0.10
0.05
0.00
0 1 2 3 4 5 6 7 8 9 Temporal window
Figure 3: Ratio of peak occurrence in non-stationary events.
this objective, first we focus on the study of event temporalities to investigate the presence vs. absence of differences in event lifetimes and then cross the spatial and temporal dimensions to understand the event propagation trend.
4.2.1 Analysis of event temporalities. Our aim here is to analyse the temporal evolution of events. Accordingly, we first identify the relevant temporal window to be used in the study. Based on the average duration of events (∼5h) and standard deviation (∼2h), we split the events into intervals of 3h durations, as shown in Table 3. The results show that most events (66.83%) last between 3h and 6h and that very few are short (6.59%) or very long (6.58%). By cross-looking at the event size -in terms of number of posted tweetsper range of duration, we found a moderate positive correlation (Pearson coefficient correlation = 0.613). This suggests that tweet publications during an event have the same trend as the event does.
To gain a clear understanding of this observation, we split each event into 10 windows of equal-size and then, for each window, computed the number of tweets that were posted during the temporal interval. We studied the stationarity of the resulting time series using the Kwiatkowski Phillips Schmidt Shin (KPSS) test [17]. We found that only 28% of events are non-stationary (p < 0.05) which suggests the presence of peaks. For those non-stationary temporal series, we further determined the temporal windows within which the peaks occur (Figure 3). We can see that approximately 35% of the candidate peaks (which represent ∼9% of the overall events) appear at the birth of the event. This observation seems to be quite obvious because the latter is mechanically used to detect the event itself. To check this feeling, we computed the statistical differences in the propagation trends of events with peaks and those without peaks using focus, entropy and location-based feature values. We used the Welch’s t-test [28] which does not assume equal population variance. Table 4 provides a summary of these feature
values and the associated standard statistical indicators. The significance of the difference between feature means as determined by the obtained p-value and the level of significance are respectively reported in the last two rows of Table 4. We can observe that no significant difference has been reported for each of the studied features. Combining all these observations about temporal users’ tweet publication, we hypothesize that, unlike for global events, the notion of peaks does not really make sense for small-scale events. Thus we consider all the events at the same level of interest in the following spatio-temporal analysis.
Table 4: Comparison of events with peak vs. without peak.
Level POI # Events Focus Entropy Distance Distance User - User Focus - User
Events with peak 113 0.65 1.78 0.313 0.201 Events without peak 297 0.66 1.52 0.271 0,169
t-test p-value - 0.803 0.108 0.401 0.386 Test significance - = = = =
4.2.2 Analysis of spatio-temporal event trends. Our objective at this stage is to understand the spatio-temporal dynamics of events. In light of our objective, we split the events into 10 windows of equal-size and calculate the average entropy, He(t), and focus, Fe(t), for each temporal window. The results are shown in Figure 4. Looking specifically first at the entropy, we observe at the neighbourhood level, the entropy slightly increases (from 0.31 to 0.64) which indicates that small-scale events do not really propagate through different neighbourhoods. Therefore, events remain confined within less than 2 neighbourhoods, on average. At the POI level, when the events begin, tweets are posted from a limited number of POIs (less than 2 POIs on average since He(0) = 0.59). Then, the events tend to quickly propagate to approximately 2 locations in the first half of the event duration (He(5) = 1.13), before stabilizing thereafter at approximately 3 POIs (He(9) = 1.59). To measure the impact of the entropy increase on the concentration of tweets that are published within the same location, we turn our attention to the evolution of the average geographical focus. At the beginning of an event (i.e., during the first temporal window), the focus values are high: 88% and 78% at the neighbourhood and POI levels respectively. They slightly decrease as the event unfolds and stabilizes
Figure 4: Average event entropy He(t) and focus Fe(t) evolution over time.
when reaching half of the event duration. Finally, 83% (resp. 66%) of tweets are posted from the focus at the neighbourhood (resp. POI) level. Moreover, we note that the coarser the level, the faster the focus values stabilize. Despite this drop in focus, the latter is still informative at any time of the event since it systematically attracts more than 50% of tweets (Fe ≥0.5) regardless of the spatial level or the temporal window. Combining our observations about entropy and focus dynamics as highlighted from results, we conjecture that the more scattered an event is, the less a single location draws most of the users’ attention. 4.3 Event types (RQ3)
Our practical objective here is twofold: (1) investigate wether specific types of events can emerge from the users’ posts; (2) characterise the event types (if present) w.r.t topical and audience features.
4.3.1 Identification of event types. Building on previous results, we consider results at POI level only, and use the focus as a criterion for event categorization. More specifically, we split the events into 5 clusters according to their focus values and compute the average entropy and distance per event cluster and per temporal window as shown in Figure 5. Points labelled with 0 are associated with the first temporal window whereas points labelled with 9 are associated with the last window5. At a general glance, we can see that the clusters follow the same pattern: the distance values slightly increase during the event lifetime whereas the entropy quickly increases until half of the event duration and then remains stable. However a deeper analysis identifies three types of events from this result. The first type (solid line) consists of the 21% of events belonging to the 2 top clusters in Figure 5 that are associated with low focus values (0 ≤Fe ≤0.4) and labelled as Group A. Events belonging to this type are spread between approximately 2 POIs from the beginning (He(0) > 1.11) and continue to propagate across 8 to 20 POIs during their lifetimes (3.05 < He(9) < 4.34). Moreover, they also spatially spread based on the increase in the average distance between users. These events are dynamic events that reach a wide audience since they propagate to both multiple locations and multiple geographic areas. The second type of events (dashed line) consists of the 37% of events belonging to the 2 median event clusters in Figure 5 that are associated with moderate focus values (0.4 ≤Fe ≤0.8) and labelled as Group B. They globally remain concentrated within the same area, i.e., the distance slightly increases, but they spread over several locations. They arise in less than 2 POIs (He(0) < 1) and propagate quickly across 2 to 4 POIs (1.14 < He(3) < 1.71) for the first third of the event duration. For the remaining lifetimes, the events no longer propagate (i.e., their entropies remain stable). Finally, the third type of events (no line) consists of the 42% of events belonging to the cluster at the bottom in Figure 5 that have high focus values (0.8 ≤Fe ≤1) and labelled as Group C. Events that fall within this group are very localized bringing people together in a single POI. Their entropies and distances do not change during the event.
4.3.2 Characterisation of event types. To gain better insights from the event types identified from the previous analysis, we performed a qualitative analysis at the topical level enhanced with a quantitative analysis of audience (in terms of number of users involved in events). Basically speaking, a topic is a common subject
5For the sake of readability, labels associated with intermediate windows are omitted.
1.0
9
Average event distance
0.8
0
9
0.6
Group A
0.0 - 0.2 (6%)
0
0.4
0 9
0.2 - 0.4 (15%)
0.4 - 0.6 (17%)
0 9
0.2
0.6 - 0.8 (20%)
Group B
0
0.8 - 1.0 (42%)
Group C
9
1 2 3 4 Average event entropy
Figure 5: Evolution of the averaged distance and entropy values at POI level.
discussed in the Twitter stream. Given that the datasets used in our study are geo-tagged in New York City and that we are interested in event topics, we used the topic labels of the NY Times medium as already done in previous work on Twitter datasets [34]. The topic categories are Arts, World, Business, Sports, Style, Technology and Science, Health, Education and Travel. To perform the topic labelling task, we first built 3 event groups (Group A, Group B, Group C) by splitting the original event dataset per event type identified previously. Then we applied in each event group the Latent Dirichlet Allocation (LDA) model [8] to the meta-documents built from the tweets belonging to each event and then tuned the optimal number of topics using the perplexity measure [8]. We reached a minimal perplexity value of 27.6, 20.1 and 17.3 at 30 topics respectively for Group A, Group B and Group C. Each topic from the 90 automatically extracted LDA topics (30 topics extracted from each group) was labeled by 4 human assessors who were instructed to define topic labels w.r.t the NY Times topic categories if relevant and to assign to the ’Other’ topic category if no relevant NY topic category matched the LDA topic. Assessors’ agreement was estimated using the Fleiss Kappa cœfficient and revealed a moderate agreement with value of 59.68%. A final topic category has been assigned to each event by applying the majority voting strategy. To have a picture of the group characteristics at the event level, we mapped the group topics to event topics by using the LDA inference algorithm [8] and then computed for each group the distribution of events and audience w.r.t each topic category, as shown in Figure 6. From a general view, we can see that apart from the ’Other’ category, the topics extracted from all the event groups are mostly related to Arts (resp. 48%, 28%, 28% for group A, B and C) and Sports (resp. 14%, 21%, 52% for group A, B and C). The observation about the relative high size of the ’Other’ category is consistent with previous work which have shown that Twitter streams give rise to specific topics that do not always fit with standard categorical topics [29, 34]. Thus, we further asked the annotators to assign Twitter labels as provided in [34] to the events belonging to the ’Other’ category. The annotation performed with a moderate Fleiss Kappa agreement of 56.87% showed that most of the topics belong to the ’Family and life’ category (resp. 55%, 56% and 97% events for Group A, B, and C) which is one of top hot topics addressed in Twitter including highly
42 12 2 31
Group A
Events
Users
3514 501 29 2441 (21%)
43 32 14 61
Group B
(37%)
Events
Users
1514 1858 942 2426
47 88 34
Group C
(42%)
Events
Users
601 8217 732
0 20 40 60 80 100
Figure 6: Distribution of number of users and number of tweets w.r.t event groups and topics.
personal and opinionated tweets. We can also observe from Figure 6 the following: (1) Group A is characterised with the lowest number of events (21%) and the highest average audience per event6 (74). Group A seems to represent a set of few important events since they are moreover spatially spread as shown in the previous analysis. (2) In Group B, the average audience is less important (45) than in Group A but users are involved in a higher number of events (37%) and address more diverse topics including Art, Sport, Politic and Other. Combining this observation with the spatial analysis, we expect that events in this group are more likely to be less important events in wide-open spaces. (3) Group C includes the highest proportion of events (42%) with an average audience per event higher than in Group B (56, but still lower than in Group A), with however comparable topic diversity. Combining these observations with the spatial narrowness of users involved in this group of events suggests that Group C includes numerous and topically diverse micro-events with a low spatial impact. A qualitative annotation of a sample of events allowed us to confirm our expectations. For instance the Global citizen festival and the Race of the cure events which are well known periodic events in the US fall into the Group A, the Tennis US Open and the NY Comic Con fall into the Group B, while we found numerous private concerts and soccer matches in the Group C.
5 CONCLUSION AND IMPLICATIONS
In this paper, we analysed the spatio-temporal dynamics of smallscale events. Our primary objective was to determine the perimeters of their geographical social impacts at different levels of location granularity, and to gain understanding of their audience and the general trends of their propagation along their lifetimes. Our results suggest the following trends:
• In response to RQ1, the results show that the focus is a significant origin location from which users post their tweets, particularly at coarser levels of location granularity. Moreover, even if events propagate over several locations, they mostly reach narrow regions. Building on these findings, one relevant practical implication that we envision is the design of information seeking algorithms that are able to timely and automatically enlarge the event propagation diameter
6Ratio between total number of users and total number of events in the group.
by rooting event mentions to users who are located in narrowed regions. User’s location, if not explicitly provided, could either be inferred using improved state-of-the art algorithms for tweet geo-location [15]. This would increase the situational awareness particularly during security incidents.
• In response to RQ2, we found that the temporal series of events are mostly stable which suggests the absence of significant peaks. We also found that evently timely evolve from diverse locations and quickly stabilize not significantly far from the focus. A relevant research opportunity that arises from this study is to examine these findings alongside previous research findings about large-scale event detection [6] to design novel algorithms that can jointly detect both weak and strong signals in Twitter streams considering appropriate spatio-temporal distribution and density of posts. Such general detectors can provide means for monitoring people’ activities (eg., for public order maintenance purpose).
• In response to RQ3, we found that we can detect distinct types of events with evolutions that are significantly different according to audience, focus concentration and propagation distance trends over time. Based on these findings, the implications for further theoretical investigation is to develop models for predicting event type based on the event-related features. Event type prediction would be a prior step to the development of an automatic visual summarization method that would give a high-level picture of what is happening in a region. Our study has some limitations. First, we only used the focus, entropy and distance metrics to report the analysis results. Although these measures are the primary metrics that are used for the spatiotemporal analysis of events, they are still insufficient for revealing other relevant facets such as propagation rate. Second, enlarging the spatio-temporal scope of our study to other cities and during different periods might give better insights about the generalisability of our findings. This investigation is planned for future work.
ACKNOWLEDGMENTS
This research was supported by IRIT and ATOS research program under ANRT CIFRE grant agreement.
REFERENCES
[1] Hamed Abdelhaq, Christian Sengstock, and Michael Gertz. 2013. Eventweet:
Online localized event detection from twitter. PVLDB Endowment 6, 12 (2013), 1326–1329. [2] Charuc C. Aggarwal and Karthik Subbian. 2012. Event Detection in Social Streams.
In Proceedings of the 2012 SIAM International Conference on Data Mining (SDM’12). SIAM, 624–635. [3] Paolo Arcaini, Gloria Bordogna, Dino Ienco, and Simone Sterlacchini. 2016. User-
driven geo-temporal density-based exploration of periodic and not periodic events reported in social networks. Information Sciences 340-341 (2016), 122 – 143. [4] Sebastien Ardon, Amitabha Bagchi, Anirban Mahanti, Amit Ruhela, Aaditeshwar
Seth, Rudra Mohan Tripathy, and Sipat Triukose. 2013. Spatio-temporal and Events Based Analysis of Topic Popularity in Twitter. In The 22nd ACM International Conference on Information and Knowledge Management (CIKM ’13). ACM, 219–228. [5] Sitaram Asur and Bernardo A. Huberman. 2010. Predicting the Future with Social
Media. In Proceedings of the 2010 IEEE/WIC/ACM International Conference on Web Intelligence and Intelligent Agent Technology (WI-IAT ’10). IEEE, 492–499. [6] Farzindar Atefeh and Wael Khreich. 2015. A survey of techniques for event
detection in twitter. Computational Intelligence 31, 1 (2015), 132–164. [7] Hila Becker, Mor Naaman, and Luis Gravano. 2011. Beyond Trending Topics: Real-
World Event Identification on Twitter.. In Proceedings of the Fifth International
Conference on Weblogs and Social Media (ICWSM’11). AAAI, 438–441. [8] David M. Blei, Andrew Y. Ng, and Michael I. Jordan. JMLR’03. Latent Dirichlet
Allocation. Journal of Machine Learning Research 3 (JMLR’03), 993–1022. [9] Anders Brodersen, Salvatore Scellato, and Mirjam Wattenhofer. 2012. YouTube
Around the World: Geographic Popularity of Videos. In Proceedings of the 21st World Wide Web Conference 2012 (WWW’12). ACM, 241–250. [10] Zhiyuan Cheng, James Caverlee, and Kyumin Lee. 2010. You Are Where You
Tweet: A Content-based Approach to Geo-locating Twitter Users. In Proceedings of the 19th ACM Conference on Information and Knowledge Management (CIKM ’10). ACM, 759–768. [11] Gabriel Pui Cheong Fung, Jeffrey Xu Yu, Philip S. Yu, and Hongjun Lu. 2005.
Parameter Free Bursty Events Detection in Text Streams. In Proceedings of the 31st International Conference on Very Large Data Bases (VLDB ’05). ACM, 181–192. [12] Bo Hu and Martin Ester. 2013. Spatial Topic Modeling in Online Social Media for
Location Recommendation. In Seventh ACM Conference on Recommender Systems (RecSys ’13). ACM, 25–32. [13] Allan James, Carbonell Jaime, Doddington George, Yamron Jonathan, and Yang
Yiming. 1998. Topic Detection and Tracking Pilot Study Final Report. In DARPA Broadcast News Transcription and Under standing Workshop (BNTUW ’98). Morgan Kaufmann Publishers, 194–218. [14] Krishna Y. Kamath, James Caverlee, Kyumin Lee, and Zhiyuan Cheng. 2013.
Spatio-temporal Dynamics of Online Memes: A Study of Geo-tagged Tweets. In The 22nd International World Wide Web Conference (WWW ’13). ACM, 667–678. [15] Sheila Kinsella, Vanessa Murdock, and Neil O’Hare. 2011. "I’M Eating a Sandwich
in Glasgow": Modeling Locations with Tweets. In Proceedings of the 3rd International CIKM Workshop on Search and Mining User-Generated Contents (SMUC ’11). ACM, 61–68. [16] Efthymios Kouloumpis, Theresa Wilson, and Johanna D Moore. 2011. Twitter
sentiment analysis: The good the bad and the omg! Icwsm 11 (2011), 538–541. [17] Denis Kwiatkowski, Peter C.B. Phillips, Peter Schmidt, and Yongcheol Shin. 1992.
Testing the null hypothesis of stationarity against the alternative of a unit root: How sure are we that economic time series have a unit root? Journal of Econometrics 54, 1 (1992), 159 – 178. [18] Kathy Lee, Ankit Agrawal, and Alok Choudhary. 2013. Real-time Disease Surveil-
lance Using Twitter Data: Demonstration on Flu and Cancer. In The 19th ACM
SIGKDD International Conference on Knowledge Discovery and Data Mining (KDD ’13). ACM, 1474–1477. [19] Deepa Mallela, Dirk Ahlers, and Maria Soledad Pera. 2017. Mining Twitter
Features for Event Summarization and Rating. In Proceedings of the International Conference on Web Intelligence (WI ’17). ACM, 615–622. [20] Andrew J. McMinn, Yashar Moshfeghi, and Joemon M. Jose. 2013. Building a
Large-scale Corpus for Evaluating Event Detection on Twitter. In The 22nd ACM International Conference on Information and Knowledge Management (CIKM ’13). ACM, 409–418. [21] Stuart E Middleton, Lee Middleton, and Stefano Modafferi. 2014. Real-time crisis
mapping of natural disasters using social media. IEEE Intelligent Systems 29, 2 (2014), 9–17. [22] Alan Mislove, Bimal Viswanath, Krishna P. Gummadi, and Peter Druschel. 2010.
You Are Who You Know: Inferring User Profiles in Online Social Networks. In Proceedings of the Third International Conference on Web Search and Web Data Mining (WSDM ’10). ACM, 251–260. [23] Takeshi Sakaki, Makoto Okazaki, and Yutaka Matsuo. 2010. Earthquake Shakes
Twitter Users: Real-time Event Detection by Social Sensors. In Proceedings of the 19th International Conference on World Wide Web (WWW ’10). ACM, 851–860. [24] Axel Schulz, Eneldo Loza Mencía, and Benedikt Schmidt. 2016. A Rapidprototyping Framework for Extracting Small-scale Incident-related Information in Microblogs. Information Systems 57, C (2016), 88–110. [25] Axel Schulz and Petar Ristoski. 2013. The Car that Hit The Burning House: Under-
standing Small Scale Incident Related Information in Microblogs. In Proceedings of the Seventh International Conference on Weblogs and Social Media (ICWSM’13). AAAI, 11–14. [26] Axel Schulz, Benedikt Schmidt, and Thorsten Strufe. 2015. Small-Scale Incident
Detection Based on Microposts. In Proceedings of the 26th ACM Conference on Hypertext & Social Media (HT’15). ACM, 3–12. [27] Sarah Vieweg, Amanda L. Hughes, Kate Starbird, and Leysia Palen. 2010. Mi-
croblogging During Two Natural Hazards Events: What Twitter May Contribute to Situational Awareness. In Proceedings of the 28th International Conference on Human Factors in Computing Systems (CHI ’10). ACM, 1079–1088. [28] B. L. Welch. 1947. The Generalization of Student’s Problem When Several Differ-
ent Population Variance Are Involved. Biometrika 34, 1-2 (1947), 28–35. [29] David Wilkinson and Mike Thelwall. JASIST’12. Trending Twitter topics in Eng-
lish: An international comparison. Journal of the American Society for Information Science and Technology (JASIST’12), 1631–1646. [30] Sarita Yardi and danah boyd. 2010. Tweeting from the Town Square: Measuring
Geographic Local Networks. In Proceedings of the Fourth International Conference on Weblogs and Social Media (ICWSM’10). AAAI, 194–201. [31] Chao Zhang, Liyuan Liu, Dongming Lei, Quan Yuan, Honglei Zhuang, Tim
Hanratty, and Jiawei Han. 2017. TrioVecEvent: Embedding-Based Online Local Event Detection in Geo-Tagged Tweet Streams. In Proceedings of the 23rd ACM SIGKDD International Conference on Knowledge Discovery and Data Mining (KDD ’17). 595–604. [32] Chao Zhang, Guangyu Zhou, Quan Yuan, Honglei Zhuang, Yu Zheng, Lance
Kaplan, Shaowen Wang, and Jiawei Han. 2016. GeoBurst: Real-Time Local Event Detection in Geo-Tagged Tweet Streams. In Proceedings of the 39th International ACM SIGIR conference on Research and Development in Information Retrieval (SIGIR ’16). ACM, 513–522. [33] Kaiqi Zhao, Gao Cong, and Aixin Sun. 2016. Annotating Points of Interest with
Geo-tagged Tweets. In Proceedings of the 2016 ACM on Conference on Information and Knowledge Management (CIKM’16). ACM, 417–426. [34] Wayne Xin Zhao, Jing Jiang, Jianshu Weng, Jing He, Ee-Peng Lim, Hongfei Yan,
and Xiaoming Li. 2011. Comparing Twitter and Traditional Media Using Topic Models. In Proceedings of the 33rd European Conference on Advances in Information Retrieval (ECIR’11). ACM, 338–349.
Source facsimiles for figures, tables, and equations
The following native-image page facsimiles preserve the source rendering for each identified figure, table, and equation.
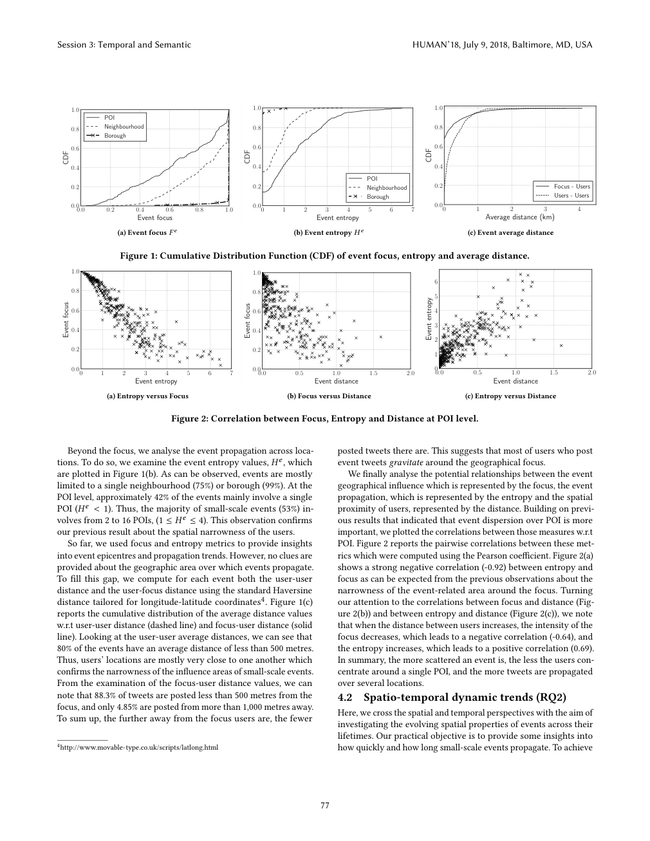
Figure 1: Cumulative Distribution Function (CDF) of event focus, entropy and average distance.
Figure 2: Correlation between Focus, Entropy and Distance at POI level.
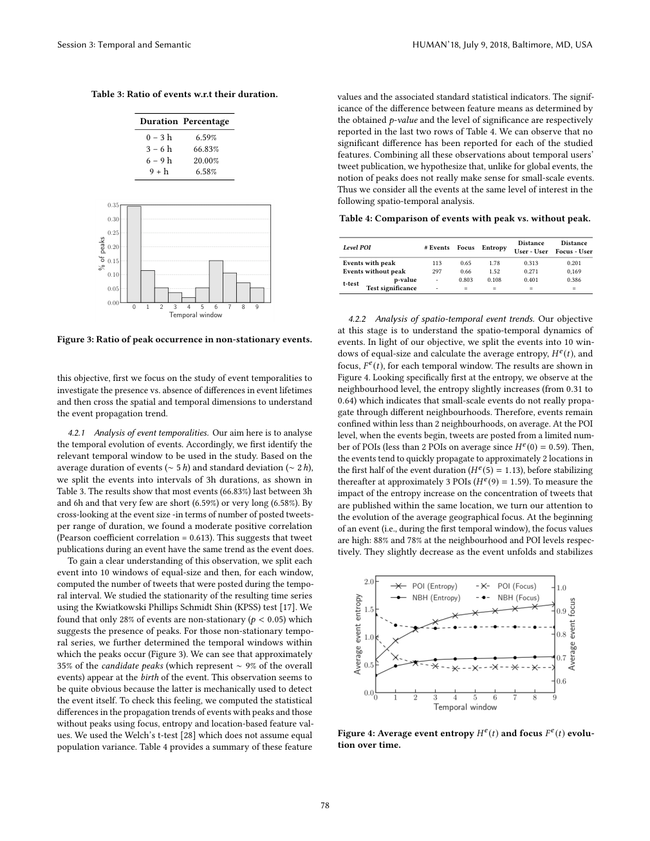
Figure 3: Ratio of peak occurrence in non-stationary events.
Figure 4: Average event entropy He(t) and focus Fe(t) evolu-
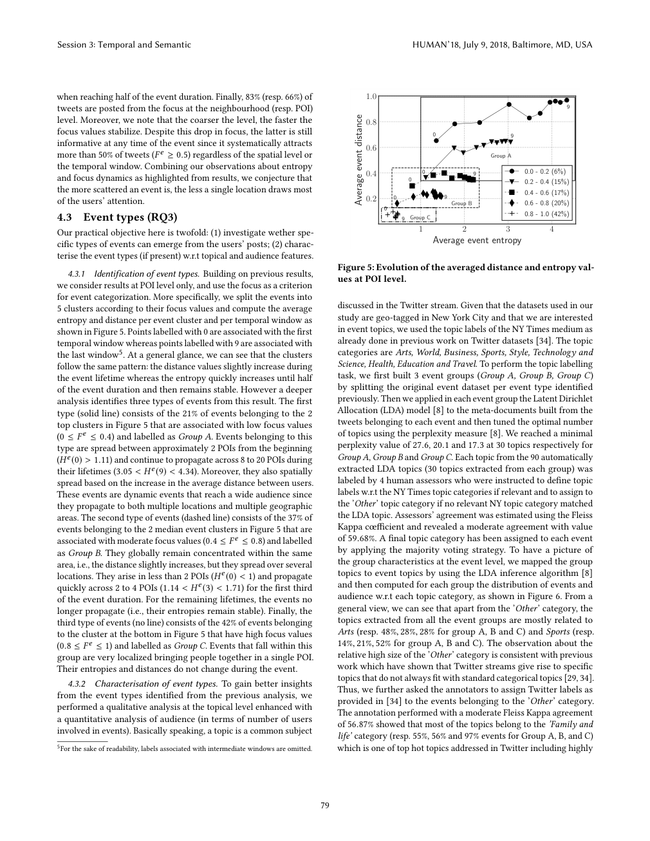
Figure 5: Evolution of the averaged distance and entropy val-
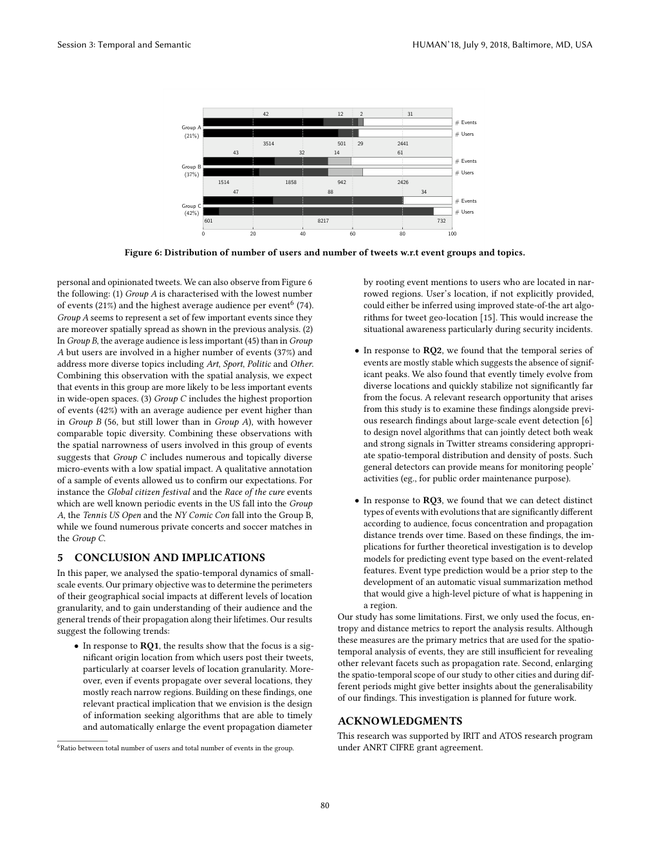
Figure 6: Distribution of number of users and number of tweets w.r.t event groups and topics.
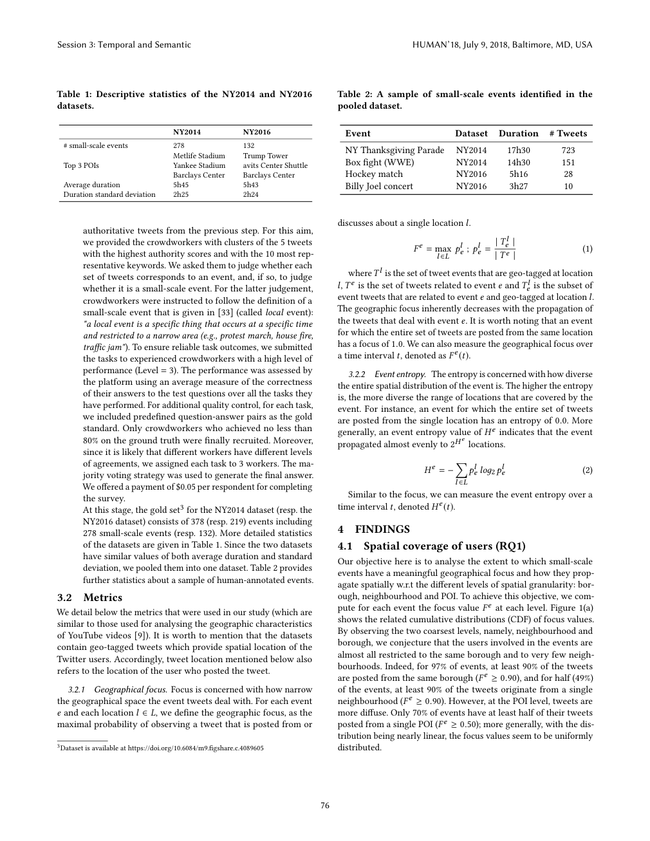
Table 1: Descriptive statistics of the NY2014 and NY2016
Table 2: A sample of small-scale events identified in the
Table 3: Ratio of events w.r.t their duration.
Table 4: Comparison of events with peak vs. without peak.
Equation source facsimile, page 3.
Equation source facsimile, page 4.
Equation source facsimile, page 5.
Equation source facsimile, page 6.
Equation source facsimile, page 7.
Complete source-page facsimiles
The following native IPFS images retain the complete original pages for visual verification.
Source PDF page 1.
Source PDF page 2.
Source PDF page 3.
Source PDF page 4.
Source PDF page 5.
Source PDF page 6.
Source PDF page 7.
Source PDF page 8.
Source PDF page 9.
Do you like what you are reading? Subscribe to receive updates.
Unsubscribe anytime