

Co-authorship 2.0
Authors: David Laniado, Riccardo Tasso
ACM Hypertext 2011 · DOI: 10.1145/1995966.1995994
Patterns of collaboration in Wikipedia
∗Barcelona Media – Innovation Centre ‡ Politecnico di Milano Information, Technology and Society Group Dipartimento di Elettronica e Informazione
∗, ‡
David Laniado
david.laniado@barcelonamedia.org
ABSTRACT
The study of collaboration patterns in wikis can help shed light on the process of content creation by online communi- ties. To turn a wiki’s revision history into a collaboration network, we propose an algorithm that identifies as authors of a page the users who provided the most of its relevant content, measured in terms of quantity and of acceptance by the community. The scalability of this approach allows us to study the English Wikipedia community as a co-authorship network. We find evidence of the presence of a nucleus of very active contributors, who seem to spread over the whole wiki, and to interact preferentially with inexperienced users. The fundamental role played by this elite is witnessed by the growing centrality of sociometric stars in the network. Iso- lating the community active around a category, it is possible to study its specific dynamics and most influential authors.
Categories and Subject Descriptors
H.5.3 [Information Interfaces]: Group and Organization Interfaces—Computer-supported cooperative work, Web-based interaction
General Terms
Human Factors
Keywords
Wikipedia, collaboration network, online production, social network analysis
INTRODUCTION To describe the successful history of Linux, E.S. Raymond introduced the metaphor of the bazaar, a new bottom up model made possible by Internet and based on the free col- laboration of thousands of volunteers spread all over the world, opposed to the cathedral, the traditional hierarchical
Permission to make digital or hard copies of all or part of this work for personal or classroom use is granted without fee provided that copies are not made or distributed for profit or commercial advantage and that copies bear this notice and the full citation on the first page. To copy otherwise, to republish, to post on servers or to redistribute to lists, requires prior specific permission and/or a fee. HT’11, June 6–9, 2011, Eindhoven, The Netherlands. Copyright 2011 ACM 978-1-4503-0256-2/11/06 ...$10.00.
‡
Riccardo Tasso
riccardo.tasso@gmail.com
model [33]. Whereas to build a cathedral everything is pro- jected in detail from the beginning by a few people, and some experts work, mainly in isolation, for the development of its single parts, in the bazaar anyone can propose tweaks and changes, which are managed by the community in a contin- uous spontaneous process of natural selection. In Wikipedia the bazaar model is at the basis of the development of a col- laborative encyclopedia, that anyone armed with Internet connection and a Web browser can edit.
This community effort has resulted in one of the largest collaborative projects in human history, and as such has attracted the attention of many researchers, who have ana- lyzed its social dynamics from different perspectives to shed light on the process of content creation by a community. In- deed, the analogy with a scientific collaboration community has been proposed in the literature and is straightforward, as editing of a wiki encyclopedia entry somehow resembles the collaborative writing of a scientific paper [15]. Studying Wikipedia as a co-authorship network can allow for a com- parison with scientific communities widely studied in litera- ture, and unveil patterns of collaboration that are hidden in the revision history. Nevertheless, to the best of our knowl- edge there is still no extensive study on the community of Wikipedia contributors as a co-authorship network. Current methods are mostly based on the assumption that just the fact that two users edited the same page is enough to estab- lish a relationship, and fail to scale to the size of Wikipedia in a major language.
The first contribution of this paper is the development of a general and scalable methodology to extract a co-author network from a wiki’s revision history. One fundamental difference between a paradigmatic case of scientific collab- oration community and a wiki is that collaboration on a wiki article has lower barriers than the process of publish- ing a scientific paper together, and does not imply previous agreement. Moreover, size of contributions can be strongly uneven, and not all edits are accepted by the community. Considering as co-authors all users who just edited the same article may bring to establish too many connections between people that were not really involved in writing something together; this would result in an extremely large and dense network. To select those who can be considered the “real” authors of a wiki article, and to account for the process of convergence toward a shared outcome, we rely on a met- ric which evaluates contribution according to the longevity of the modifications introduced [1]. According to this mea- sure, we define a method to select the main contributors of
each page as the ones who provided the most of its accepted content, and to obtain a collaboration network.
Our second contribution consists in the analysis of the co-authorship network obtained from a complete dump of the English Wikipedia, to characterize its community on a temporal dimension. The study of the network’s macro- scopic features and the comparison with scientific collabo- ration networks help understand the way the community is structured and the role of administrators and most involved users, pointing out the existence of specific patterns of col- laboration.
In the next Section we offer a brief overview on the com- munity of Wikipedia contributors, based on previous stud- ies. Then in Section 3 we describe our algorithm to extract a co-authorship network from a wiki’s revision history, while in Section 4 we show the results we obtained for the English Wikipedia, analyzing the evolution of different macroscopic properties of the network and investigating the role of the most influential users. Finally in Section 5 we discuss con- clusions and directions for future work.
RELATED STUDIES An in-depth qualitative description of social dynamics and established rules and conventions in Wikipedia is offered in [7], whose authors investigate how new users can move from legitimate peripheral participation to full community involvement and how their activity can change substantially over time, moving from local focus on individual articles to a concern for the quality of Wikipedia content as a whole and for the health of the community.
One of the first extensive quantitative studies on the Wi- kipedia community was presented in [36], where its growth is shown to follow an exponential trend, after a first lin- ear phase; both the number of authors per articles and vice versa the number of articles per author exhibit a power law distribution. Almeida et al. [2] characterized the evolution of Wikipedia as a self-similar process growing exponentially, due especially to the continuous increase of the number of contributors. They also observed that the distribution of the number of updates per user follows two Zipf’s laws with dif- ferent parameters, which split the community in two groups: a small nucleus of around 5000 very active users, who con- tribute more than 1000 articles, and the vast majority of common contributors.
Kittur et al. [19] divide Wikipedia contributors into dif- ferent categories according to their degree of participation in terms of number of edits. They observe at first the rise of an elite of very active users, who perform the most of edits, and then the decline of this “elite” in virtue of what they call the “bourgeoisie”, the large majority of common users. Or- tega et al. [31] found out that the 10% of contributors were responsible for more than the 90% of edits; they also noticed that this strong inequality tends to stabilize over time. The effect of contribution inequality on the quality of Wikipedia articles has been investigated in [3]: a positive effect of global inequality, measured according to the Gini coefficient of edit count distribution, is found. Kittur et al. [21] study the role of coordination, observing improvements in article quality as effect of both explicit coordination through communica- tion, and implicit coordination through concentrating the majority of the work in the hands of a subset of users.
In [15] Wikipedia is studied as a peer review system; no evidence is found that experience helps editors avoid rejec-
tion, while the authors observe a strong tendency of users to defend their own contributions.
The first relevant attempt to study the social network of Wikipedia editors, to the best of our knowledge, was done in [23]: a directed graph is drawn to represent the network of consequent edits to a page and to evaluate the authority of authors over an article or a domain, and the degree of centralization of an article. Brandes et al. [6] represent the contributors of a page as nodes, and the different kinds of actions linking them as edges, with attributes expressing the numbers of deleted, undeleted and restored words. By means of this kind of network, the authors study the different roles of users and the collaborative structure of pages, and they try to identify poles of opinion. Iba et al. [18] focus on the network based on consecutive edits done to a page, in order to identify editing patterns using dynamic social network analysis. The models proposed in these studies are useful to represent interactions over one or few pages, while our concern is to characterize the whole community.
Closer to our work are studies which take into account the collaboration network in a wiki as an affiliation net- work. Biuk-Aghai [5] proposes a visualization method which exploits co-authorship networks to compute the similarity between Wikipedia pages. In [35] a method is described to measure co-authorship relationships in MediaWiki; the model allows for the representation of weighted relation- ships, where the relevance of each collaboration is computed according to the temporal overlap in the activity of two au- thors on a same page, and to the proportion of their edits with respect to the total revisions of that page. M¨uller-Birn et al. [25] combine different measures in order to evaluate au- thor activity in wikis: besides edit count, they compute for each author also a measure of content significance based on tf-idf model, and metrics of centrality in the social network. The first results, on a small collection of articles, show that the three criteria bring to quite different rankings. A model based on a tripartite network is presented in [26], the three dimensions being users, pages and categories. Klamma et al. [22] propose a model to study wikis as social networks, taking into account articles, revisions, users and URLs, and apply dynamic network analysis to several wikis; as they consider all edits for the construction of the networks, the model cannot scale to the size of Wikipedia in a major lan- guage. All of these studies differ from ours in that they are only based on the edits done to a page, without accounting for differences in the contribution carried by different edits.
The network of replies between users in Wikipedia discus- sion pages is analyzed in [24], while the interplay between social ties and similarity is studied in [10], where feedback effects are found between personal communications and edit- ing of the same articles. The network of personal communi- cations is also studied in [13] to characterize different profiles of users.
FROM REVISION HISTORY TO A CO- AUTHORSHIP NETWORK In the last decade, the availability of comprehensive on- line bibliographies has made possible the extensive study of co-authorship networks for entire fields; in particular, large-scale networks have been constructed to represent co- authorship collaborations in physics [4], mathematics, neu- roscience, biology and computer science [29, 27]. The study
of these networks has shown to be a useful source of informa- tion on the academic communities, both for local and global analysis.
As discussed in the previous Section, the analogy between Wikipedia and a scientific collaboration community is not new in literature as a potential useful means to study its social structure and dynamics from a sociometric perspec- tive, and some methods have been proposed to extract a collaboration network from a wiki [23, 35, 25, 22]. However, current methods are mostly based on the assumption that just the fact that two users edited the same page is enough to establish a relationship, and fail to scale to the size of Wi- kipedia in a major language. In our opinion the approach of including any user who edited a page as an author is an over- simplification; in effect, we would like to extract the main contributors of a page, both in terms of quantity and qual- ity of their interventions. In particular, while to publish a scientific paper together two researchers need to know each other in advance, and then to agree on the final version of the paper, in a wiki it is just a matter of editing the same page; by taking into account the degree of acceptance that a contribution has received by the community, we try to make up for the lack of explicit agreement between users in previous models.
We propose an algorithm that acts in three main steps: at first, for each page a score is computed to evaluate the contribution of its editors, then the main contributors are se- lected as authors of the article, and finally the co-authorship network is constructed. In the following we will illustrate these three steps.
3.1 Measuring contribution The first step of our method requires the computation of author contribution in the scope of each wiki page. We need a function:
c : U × P →[0, +∞) (1)
which, given a user in the set of registered users U and a page in the set of pages P, has two main requirements. First it has to return a positive numerical value. This is because with such a function we can calculate the total contribution for a page, and estimate the relative influence of each user on it. Then, in order to perform temporal studies, it is required to the function to be computable within specified intervals of time. This definition is quite general, and any measure quantifying the contribution of a user to a page can be used.
Most of the quantitative studies on the Wikipedia com- munity just take into account the number of edits performed by a user as a measure of her activity; this naive measure is often used also inside the same community of Wikipedia (e.g., to be elected as an administrator of the Italian Wiki- pedia, a user needs to have performed at least 500 edits). Though it is largely used, due to its simplicity, the limita- tions of this approach are evident, as no importance is given either to the size or to the quality of interventions. More so- phisticated approaches to compute author contribution are based on the observation of the lifespan of the changes in- troduced. The metric proposed in [32] takes into account the number of times a word added is viewed without be- ing changed in the next revisions, while in [15] the lifespan of a word is measured according to the number of editors modifying the page without removing it. A set of metrics and efficient algorithms to compute author contribution to a
wiki is illustrated in [1], in the framework of the WikiTrust project1. Among these metrics, edit longevity is based on the number of words edited by an author, computed with suitable heuristics, and weighted according to their longevity in the following interventions.
For this work we chose to rely on the metric of edit longevity as described in [1], both for its accuracy and for the efficiency of the algorithm proposed, allowing for its computation over the whole English Wikipedia as: el : E →[−∞, +∞), E be- ing the set of all edits in the wiki. While in Wikitrust edit longevity is cumulated for each author over the whole wiki, our approach is to cumulate this measure in the scope of each single page, finding as a result a score associated to each contributor, telling how much accepted content they have introduced in a certain article. As we are interested in cumulating a measure of the relevant contribution carried by each author to a page, we do not take into account in- terventions bringing a negative score. We define Eu,p as the set of edits performed by user u on page p, and we compute the contribution of user u to page p as:
X
c(u, p) =
el(e). (2)
e∈Eu,p|el(e)>0
3.2 Author selection As pages vary substantially both in length and number of editors, it would be difficult to establish a fixed number of authors to be selected from all articles. Instead, we adopt a general and flexible strategy, which consists in selecting the first users who authored a certain percentage of the whole accepted contribution. Anonymous contributors are identi- fied in Wikipedia revision history by their IP number, so a possible strategy would be to include them in the commu- nity as single individuals, by treating IP numbers as normal user nicknames. We are not following this approach for the fundamental reason that IP numbers are not reliable iden- tifiers. Moreover, it makes sense to identify only users that explicitly chose to have a nickname in the community. So we discard all anonymous contribution. For each page p we define the set Up of all registered users who edited it. We select the set of authors of page p as the smallest subset Ap ⊆UP containing the first users of Up, ordered by de- scending contribution, such that:
P
a∈Ap c(a, p)
ctot(p) > θ (3)
where θ ∈[0, 1] is a relative threshold and ctot(p) is the total contribution to the page by registered users:
X
ctot(p) =
c(u, p)
u∈Up
Then we remove all the users whose contribution to that page, in absolute terms, did not reach a minimum threshold M, by imposing a further condition for each author a of page p:
c(a, p) > M (4)
3.3 Network construction As discussed in the previous Section, we select for each article a variable number of authors who have provided a
1http://wikitrust.soe.ucsc.edu/
significant contribution, both in absolute and relative terms, and we obtain a bipartite network, or affiliation network, where each user is associated to all the articles of which she is a main contributor. To obtain a collaboration network, G = ⟨V, E⟩, we project this bipartite network on the users’ dimension, establishing a connection between each pair of users who have collaborated on at least one article. So the set of vertices is: V = S
10 6
10 5
10 4
p∈P Ap and the set of edges is: E = {(a1, a2) | ∃p ∈P : a1, a2 ∈Ap}.
articles
10 3
To account for temporal dynamics, we consider slots of a fixed amount of time T , and we snapshot the wiki’s revision history at different instants. For each period we build a net- work based only on the edits performed in that time slice ([0, T ), [T, 2T ), · · · ), and a cumulative one considering also all previous edits ([0, T ], [0, 2T ], · · · ). With the first method we can represent the network of actual interactions between users in a limited period of time; with the second approach we consider cooperation over the whole history of each ar- ticle, coherently with the idea that, when editing a page, a user is working on all past contribution.
10 2
10 1
NETWORK ANALYSIS OF WIKIPEDIA AUTHOR COMMUNITY We applied the algorithm described in the previous Sec- tion to the English Wikipedia, to extract its co-author net- work. We based our analysis on a log from the WikiTrust project, where edit longevity has been computed for all edits until February 11th, 2007.
1.5
For scientific co-author networks the usual period of time examined is one year; this is probably due to the availabil- ity of the publication year, and to the scarce relevance of a finer-grained division of time, as the process of publish- ing can take months. As in Wikipedia everything happens faster, and the revision history provides detailed temporal data, we chose to adopt shorter periods of T = 3 months. We have constructed for each period both the cumulative and the non-cumulative network, using thresholds θ = 0.7 and M = 10, the first telling we select as authors of an ar- ticle the minimum set of top contributors responsible for at least 70% of the total contribution to it, the second estab- lishing the minimum contribution needed to be considered an author (roughly corresponding to 10 words added and never modified in the following 10 revisions)2.
articles
0.5
Figure 1 shows the number of editors per page and the number of authors selected by our algorithm, for a period of three months. As it can be noted, though there are articles edited by up to 500 users, our algorithm does never select more than 20 editors as authors of a page. Anonymous con- tribution, that we discarded, adds up to 25% of edits done, but only to 10% in terms of edit longevity. These data point out the lower weight of anonymous edits in terms of size and acceptance by the community.
users
Figure 2 shows the growth of Wikipedia in terms of num- ber of articles; together with the total number of articles, we have plotted also the number of those for which at least one and two contributors have been selected; the percentages over the whole history until February 2007 are about 97% and 39%, respectively. The graphics points out that most of Wikipedia articles have been redacted by one main editor. Analogously, besides the evolution of the total number of
2Varying the parameters we did not observe remarkable dif- ferences in the results.
10 6
users per article authors per article
10 5
10 4
articles
10 3
10 2
10 1
10 0 10 1 10 2 10 3 10 0
users, authors
Figure 1: Distribution of the number of users per page observed in a three month period (November 2006 - February 2007), plotted on a log-log scale.
2x 10 6
articles articles (at least 1 author) articles (at least 2 authors)
1.5
articles
0.5
Feb01 Feb02 Feb03 Feb04 Feb05 Feb06 Feb07 0
time
Figure 2: Evolution of the number of articles.
8x 10 5
users authors authors in network
users
Feb01 Feb02 Feb03 Feb04 Feb05 Feb06 Feb07 0
time
Figure 3: Evolution of the number of users.
Table 1: Macroscopic features of the non-cumulative network: each row describes the network of collab- orations based on the edits performed in the three month period ending on the pointed month.
Period
N ⟨k⟩ G% C d D r
Feb02
124 5.8 100 0.17 2.83 6 -0.14 May02
178 6.5 98.9 0.19 2.85 6 -0.16 Aug02
214 7.0 97.7 0.22 2.88 6 -0.11 Nov02
415 9.6 99.0 0.23 2.87 6 -0.17
Feb03
585 8.3 99.9 0.17 3.07 7 -0.14 May03
723 8.9 98.1 0.18 3.07 6 -0.10 Aug03
1199 8.5 96.2 0.14 3.26 7 -0.07 Nov03
1511 8.9 92.8 0.14 3.26 7 -0.07
Feb04
2023 10.0 97.0 0.13 3.31 9 -0.06 May04
3817 10.1 95.9 0.10 3.43 8 -0.05 Aug04
5101 9.9 97.6 0.08 3.53 9 -0.05 Nov04
6781 9.5 95.9 0.06 3.46 8 -0.08
Feb05
8643 8.6 95.9 0.07 3.75 9 -0.04 May05
11678 8.3 95.3 0.07 3.83 12 -0.02 Aug05
16622 8.3 95.3 0.07 3.91 10 -0.02 Nov05
20117 8.3 94.5 0.09 3.95 11 0
Feb06
31424 9.0 94.3 0.09 3.95 11 -0.01 May06
45069 7.5 93.1 0.04 3.96 11 -0.05 Aug06
55948 7.3 92.5 0.03 4.06 12 -0.04 Nov06
62126 6.6 91.0 0.03 4.06 12 -0.04
Feb07
64318 6.9 90.2 0.03 4.08 12 -0.03
Wikipedia users, in Figure 3 we plot the number of users selected as authors of at least one article, and the number of authors who have collaborated with at least another author; the percentages are about 29% and 24% and show that the vast majority of authors have collaborated with some other authors.
In the following we analyze the networks according to sev- eral metrics to characterize the Wikipedia community and detect patterns of collaboration. For the analysis we relied on the software package Igraph for R [11].
4.1 Macroscopic network analysis Tables 1 and 2 report the evolution of some macroscopic features of the non-cumulative and cumulative networks, re- spectively. The size of the giant component G, the largest connected component, is always over 97% in the cumulative network, showing a very scarce fragmentation; high values are observed also in the non-cumulative network. The size of the other components does never exceed 6 or 7 nodes.
In social network analysis the number of edges k incident to a node is generally called degree. Looking at the evolu- tion of mean degree ⟨k⟩over all nodes, or network connectiv- ity, in the cumulative network, we observe a rapid growth, that tends to converge around a value of 22. In the non- cumulative network, after a growth in the first periods, con- nectivity starts following a slowly decreasing trend; this is an interesting signal that the mean number of actual collab- orations during a limited period of time remains bound, and tends to decrease as a larger base of users gets involved in the community.
The networks exhibit the small world property [37]: the maximum distance, or diameter D, tends to slowly increase over time, but no more than 10 or 12 steps are required to
Table 2: Macroscopic features of the cumulative net- work: each row corresponds to the network based on the whole history of pages until the pointed month. N stands for network size.
Until
N ⟨k⟩ G% C d D r
Feb02
137 6.2 100 0.17 2.87 6 -0.11 May02
256 9.0 100 0.21 2.75 6 -0.16 Aug02
388 11.6 100 0.24 2.70 5 -0.19 Nov02
706 14.0 99.7 0.26 2.76 5 -0.23
Feb03
1116 14.7 99.5 0.24 2.83 7 -0.23 May03
1508 16.7 99.5 0.23 2.85 6 -0.21 Aug03
2315 17.1 98.6 0.22 2.92 7 -0.20 Nov03
3286 18.0 97.1 0.20 2.96 8 -0.19
Feb04
4542 19.5 97.4 0.19 2.99 8 -0.18 May04
7000 20.7 96.7 0.17 3.04 8 -0.17 Aug04
10033 22.0 97.8 0.16 3.08 9 -0.16 Nov04
14072 23.1 97.7 0.14 3.10 8 -0.16
Feb05
19004 23.5 97.8 0.13 3.14 8 -0.15 May05
25759 23.4 98.1 0.12 3.19 8 -0.14 Aug05
35408 23.6 98.1 0.11 3.24 8 -0.13 Nov05
46181 24.2 97.9 0.11 3.29 8 -0.12
Feb06
64268 24.3 97.8 0.10 3.33 9 -0.11 May06
90523 23.1 97.4 0.09 3.38 8 -0.10 Aug06
121461 22.6 97.2 0.08 3.40 10 -0.08 Nov06
154091 22.0 96.8 0.06 3.41 9 -0.08
Feb07
183710 22.4 96.7 0.06 3.41 10 -0.07
connect any pair of nodes. This value is considerably low, especially if compared with those of scientific collaboration networks, where the diameter can typically reach the value of 20 [27]. Analogously, also mean distance d exhibits a slow linear increase with time, remaining between values of 3 and 4; this result is also quite low with respect to sci- entific collaboration networks observed in literature, where the average values are usually over the double. These short distances can be explained in virtue of the lower barriers to the collaboration between any pair of users in a wiki; they can also be interpreted as an effect of the centralization of the network around some very active users, the so called sociometric stars.
4.1.1 Clustering coefficient Similar conclusions can be inferred from the observation of clustering coefficient, that is computed as:
C = 3 · number of triangles
number of connected triples of vertices
and represents the percentage of closed triples in the net- work: at the extremes, a completely connected graph has C = 1, whereas a hierarchical tree has C = 0, as no loops are possible [37]. Though our networks exhibit a clustering coefficient higher than the one of a random network, this value is very low with respect to scientific collaboration net- works observed in literature, where it also shows to be usu- ally more stable over time [27, 9]. Among the co-authorship networks studied in [29], the only one having a similar value of C is Medline, a very large community characterized by a strongly hierarchical social structure, based on laborato- ries where a high number of collaborators gravitate around a “principal investigator”. Comparable values of clustering co-
efficient have been observed in online communities [17] and
0.00 0.10 0.20
C
Feb02 Feb03 Feb04 Feb05 Feb06 Feb07
period
Figure 4: Trend of clustering coefficient in the non- cumulative network.
0.00 0.10 0.20
C
Feb02 Feb03 Feb04 Feb05 Feb06 Feb07
period
Figure 5: Trend of clustering coefficient in the cu- mulative network.
message board networks [14]; a first simple consideration can be that it is easier to establish new and heterogeneous connections with other people on the Web than in the real world.
The low and decreasing values of C in our network, shown in Figure 5, can be also seen as a symptom of the growing centralization of the network, that is accentuated as new users attach to the stars, central nodes with a very high degree. This process can be attributed to the role of some “superusers”, who seem to be omnipresent: administrators,
bots, and a core of very active contributors, who seem to intentionally spread themselves over the whole Wikipedia, covering all its areas. Some researchers claim that the de- creasing percentage of edits performed by administrators and by the most active users suggests that the Wikipedia elite is declining and a bourgeoisie is rising [19]. Though, in our analysis we find evidence of the fundamental role that these users continue playing, by leveraging their centrality in the growing network.
4.1.2 Degree distribution The uneven level of participation is confirmed by a study of the degree distribution, that is plotted in Figure 7 for the
5e−05 5e−04 5e−03 5e−02 5e−01
1 5 50 500 5000
degree
Figure 6: Degree distribution in the non-cumulative network (Nov2006 - Feb2007).
1e−05 1e−04 1e−03 1e−02 1e−01
1 10 100 1000 10000
degree
Figure 7: Degree distribution in the cumulative net- work.
cumulative network and in Figure 6 for the last three month period studied; both networks are scale free with a heavy tailed distribution. According to [7], a reason for this dis- parity in the number of collaborations may be found in the distinction between the periphery and the core of the com- munity: users who feel fully involved in the project, mem- bers of the tribe, care about the whole content of the en- cyclopedia, and their activity is substantially different with respect to the majority of users who are just interested in contributing on specific topics.
4.1.3 Degree assortativity An interesting question is whether these very central au- thors are preferentially linked with other highly connected ones or not; in other words, if the network is assortative. The assortative mixing, or degree correlation r of a net- work, measures the tendency of nodes to connect with other nodes having a similar degree [30]. Being assortative is tra- ditionally considered a characterizing feature of social net- works, in contrast with technological and biological ones, like the Internet or the WWW, which are disassortative [28]. Nevertheless, the degree assortative mixing of our networks is negative, with values increasing (decreasing in absolute value) until about -7% in the cumulative, and -3% in the non-cumulative one (Figures 8 and 9). This result marks a notable difference with respect to scientific collaboration networks, that have been shown to exhibit assortative mix- ing patterns [30]; instead, neutral or disassortative networks have been observed in other online communities such as In- ternet dating [16] and message boards [14]. This tendency has been verified for many online social networks in [17]; this recent work also highlights a transition from degree as- sortativity to disassortativity in the popular Chinese social network platform Wealink.
r
The evolution of the correlation degree coefficient we ob- serve for Wikipedia, plotted in Figures 8 and 9, exhibits a different trend, reaching highly negative values that tend to decrease over time in absolute value. One particular reason for the disassortative mixing of Wikipedia community can be found in the tendency of more involved authors to inter- act with new inexpert users, correcting and improving their contributions, rather than to collaborate with each other on the same articles. Global inequality of contribution between users collaborating on a same article has been shown to be positively correlated with article quality [3]; this social dy- namics can probably be considered one fundamental feature of the Wikipedia community, that has characterized it since the beginning, with a strong concern of the most involved users for the content of the whole encyclopedia. The trend of disassortative mixing in the cumulative network mirrors the one of the clustering coefficient, which also moves to- wards zero as the network grows in size and density, estab- lishing connections also between people who authored the same pages in different periods.
r
4.2 Centrality measures In literature, several metrics of centrality have been pro- posed to study the position and the influence of individuals in a network. Beside the first and simplest centrality metric of Degree, which just expresses the total number of collabo- rators of a user, i.e. the communication activity, others have been defined to investigate particular properties of nodes.
Betweenness is a measure based on the number of times a node occurs in the shortest path between other pairs of nodes. It is computed for node n as:
X
|pinj|
betweenness(n) =
|pij|
i,j
where, for each pair of nodes (i, j) in the network, pij are all the shortest paths between them, and pinj are the ones passing from node n. The idea is that the more betweenness a node scores the more influence it will have on information flow in the whole network, a sort of control of communica-
−0.25 −0.15 −0.05
r
Feb02 Feb03 Feb04 Feb05 Feb06 Feb07
period
Figure 8: Trend of assortative mixing by degree r in the non-cumulative network.
−0.25 −0.15 −0.05
r
Feb02 Feb03 Feb04 Feb05 Feb06 Feb07
period
Figure 9: Trend of assortative mixing by degree r in the cumulative network.
tion [12]. Nodes with high values of betweenness make the spreading of cutting-edge knowledge easier; in the case of Wikipedia it could be policies and best practices. Remov- ing such nodes typically leads to the increase of the shortest path length between nodes [37].
Closeness of a node (n) is the inverse of the average length of the shortest paths to other nodes (m) in the network (pnm) [8]; given N the number of nodes:
closeness(n) = N −1
P
m pnm
This metric expresses the capability of a node to get in touch with new ideas over the network, i.e. independence of infor- mation [12].
Eigenvector is a metric based on degree. It corresponds to the values of the first eigenvector of the network adjacency matrix [8]. Centrality of each node is so evaluated propor- tionally to the sum of the centrality of nodes it is connected to.
We computed the centrality of each user, according to the different metrics mentioned. Eigenvector centrality is the only metric which was computed on the weighted network,
Table 3: Number of Administrators, Bots and Reg- istered users in the top 100 nodes according to dif- ferent metrics for the cumulative network
Admins Bots Registered
edit count
50 27 23 edit longevity
72 6 22 degree
70 10 20 betweenness
65 12 23 closeness
73 10 17 eigenvector
30 6 64
where each edge connecting two authors is weighted accord- ing to the number of articles they co-authored.
To sketch the composition of the group of the most in- fluential authors, we counted the number of administrators, bots and registered users appearing in the top 100 positions in the rankings according to the different centrality metrics and to the measures of edit count, or number of edits done, and to edit longevity, described in Section 3.1.
As it can be noted in table 3, all centrality metrics tend to produce results comparable to the edit longevity, on which the networks are based; an interesting exception is repre- sented by the eigenvector, which tends to strongly penalize administrators; this result can be interpreted as a conse- quence of the tendency of administrators to interact prefer- entially with the most inexperienced users. A high number of bots emerges in the edit count ranking, but this presence is strongly reduced with edit longevity and network central- ity metrics; this is probably a symptom of the high number of small edits performed, and of the scarce interactions with other users, which characterize many bots.
4.3 Removing admins, bots and stars. Given the structure of the network and its disassorta- tive mixing, of particular interest can be the experiment of removing some classes of very central users and studying the resulting network. Table 4 reports the macroscopic fea- tures of the cumulative networks obtained removing various classes of users, compared with the original network.
As a first experiment we have removed administrators and bots; more precisely, we have removed all the nearly 1300 users who have been elected administrators before February 2007, and the 76 users that we have identified as bots. The peculiar role that these classes of users play inside Wikipe- dia is witnessed by the remarkable change in the network that is caused by their removal. As it can be noted, the size of the network decreases significantly: in fact, as we are not considering isolated individuals, almost 20 000 nodes get disconnected from the rest of the network after these special users are removed; also the giant component size percentage decreases. Mean distance and diameter increase, remarking the role of hubs that administrators and bots were play- ing, whereas clustering coefficient grows as the hierarchical structure of the network is partly broken with the removal of these stars. Finally, the assortative mixing coefficient in- creases, though the network keeps being disassortative.
The same phenomenons are observed after removing other very central authors; we removed the 1000 and 5000 nodes with the highest betweenness, obtaining the results shown in Table 4. Individuals having highest betweenness are the ones that are more often on the shortest path between pairs
Table 4: Macroscopic features of the cumulative net- work constructed removing some classes of users: Admins and Bots (AB), top 1000 and 5000 users having highest betweenness. Also values for the original network are reported (none).
N ⟨k⟩ G% C d D r
none
183710 22.4 96.7 0.06 3.41 10 -0.07 AB
168716 13.3 94.8 0.04 3.80 11 -0.04 1000
158956 10.0 93.0 0.05 4.24 12 0.04 5000
134802 5.2 85.9 0.10 5.44 17 0.09
of users in the network, and correspond to Wikipedians di- rectly connected with many heterogeneous authors; remov- ing these hubs it is easier to understand the sub standing structure of the network. The assortative mixing coefficient gets positive after removing the 1000 most central users; the size of the network and of the giant component get smaller as many users get disconnected, but no other connected com- ponent exceeds the size of 10 nodes. After removing 5000 authors, the size of the giant component is reduced from about 180 thousand to 115 thousand nodes, meaning that more than one third of the users were connected to the rest of the network only through these stars.
4.4 Study of subcommunities A further analysis can be performed concentrating on par- ticular semantic areas of Wikipedia, to study the communi- ties of users that are active on a specific domain. All articles in the wiki are organized in a hierarchy of categories and sub- categories, so it should be possible to pass it through and determine the whole subgraph belonging to a given higher level category. Unfortunately this is not easy, as categories are managed by users in a heterogeneous way, and the re- sult is often not a coherent hierarchy: the subcategory re- lationships cannot always be considered transitive and are sometimes used just to state a correlation between two top- ics; following the subcategory chain it occasionally happens even to fall into some loops. This as precious as impre- cise graph has been object of different studies. In particular in [20] an algorithm is proposed that, given as input a set of high-level categories, computes the degree to which an article is related to each of them, according to the length of the path; this method is useful for creating a partition of all Wikipedia articles with good approximation, and it is strongly dependent on the choice of the categories into which the articles have to be split.
As we wanted to identify subcommunities active on spe- cific topics, we relied on the approach of isolating a few well delimited lower level categories, and manually cleaning their subtrees, excluding unrelated branches. We chose three cat- egories of comparable size, from different domains: Botany, Pharmacology and Comics.
As shown in Table 5, the networks seem to share some macroscopic features of the global one: one very large con- nected component, short diameter and short average dis- tances. Clustering coefficient C reaches values remarkably higher than the ones observed over the global network. This is especially true for categories Botany and Pharmacology; the lower value observed for the category Comics seems to reflect the more occasional and sparse nature of contribu-
Table 5: Macroscopic features of the cumulative networks for categories Pharmacology, Botany and Comics.
Pharm. Botany Comics
of nodes N 5814 6500 11559 mean degree ⟨k⟩ 11.22 9.79 11.35 giant comp G% 89.8 89 92.8 clustering coeff. C 0.25 0.19 0.11 mean distance d 3.59 3.5 3.57 diameter D 11 10 10 assortativity r -0.05 -0.1 -0.06
Table 6: The 15 users with highest betweenness in the cumulative network for category Botany. Also the position in the global network betweenness rank- ing is reported for each user, together with the role.
rank betw. username role global
rank
1 4392847 MPF Admin 129 2 3050933 AntiVandalBot Bot 1 3 2035231 Tawkerbot2 Bot 2 4 1496233 Gdrbot Bot 41 5 603624 Wetman Registered 23 6 395980 Ahoerstemeier Admin 11 7 389615 JoJan Admin 1145 8 386907 Grstain Registered 137 9 386820 DanielCD Admin 173 10 379741 PDH Registered 141 11 360715 Pekinensis Registered 1921 12 344995 VivaEmilyDavies Registered 1915 13 311965 Badagnani Registered 99 14 291674 Tawkerbot4 Bot 7 15 291491 Pollinator Admin 803
tions, with respect to scientific disciplines where more spe- cific expertise on particular topics is required.
Regarding sociometric stars, we observe the prevalence of some of the same “superusers” that also emerged in the global network, but also of other users that seem to have reached a very high centrality only inside a particular area. As an example, Table 6 shows the first 15 users for between- ness in the Botany cumulative network. For each user also the role and the position in the betweenness ranking for the global network are reported: this information points out a certain heterogeneity in the composition of the core of the most central users in category Botany, and offers an inter- esting measure of the different areas of influence of users. By discarding global stars it is possible to have an idea of the most influential contributors who focused on a given area.
CONCLUSIONS AND FUTURE WORK In this work we have proposed a scalable method to ex- tract a co-author network from a wiki’s revision history, based on the idea of selecting only the main contributors of a page as its authors, and we have applied it to analyze the social structure and dynamics of the English Wikipedia author community.
The results mark a considerable difference with respect
to most of the scientific collaboration networks: very low values of mean distance and diameter, a quite low and de- creasing clustering coefficient, and disassortative mixing by degree. We find evidence of a strong centralization of the network around some stars, a considerable nucleus of very active users, who seem to be omnipresent. The high cen- trality of sociometric stars points out the key role that the “elite” continue playing in the community of Wikipedia, de-
spite the rapid growth of the number of common users. The disassortativity of the networks is a signal that the most ac- tive contributors tend to interact with the less experienced users, spreading over the whole wiki, rather than to col- laborate with each other. In this continuous relationship between the core and the periphery of the community can perhaps be found one of the constituting characteristics of the Wikipedia community.
We have also shown how the community working on a particular semantic area of the wiki can be studied; the net- works constructed for some categories tend to share the main features of the global ones, with some variations; in scientific disciplines we observe higher clustering, and lower values of disassortativity. An extensive study including a higher num- ber of categories could reveal interesting patterns. By filter- ing out the “superusers” which have a very high centrality over the global network, it is possible to identify the most influential authors in a specific area.
The study presented in this paper offers many directions for further investigation. Recent studies have pointed out a plateau effect in the growth of Wikipedia, which after 2007 seems to have significantly slowed down [34]; it would be in- teresting to inspect how the dynamics and the structure of the network have evolved. Different metrics could be used to compute author contribution; for example, a measure based only on new words added could help giving prominence to the authors who provide new content. For a more com- plete comprehension of collaboration patterns, the coauthor networks could be compared with the explicit interactions between users in discussion pages. Finally, the bipartite net- work of authors and articles is a kind of folksonomy; it can be studied as a precious source of emergent semantics, and contrasted with the category graph. The fact that each wiki page corresponds to an encyclopedic entry, and to an entity in the Semantic Web3, makes this perspective particularly promising.
Acknowledgements
All the data used in this study to measure author contri- bution to Wikipedia articles are from the Wikitrust project logs. We want to thank Luca De Alfaro, Ian Pie and Thomas Adler, who provided us this fundamental input for our work. We also thank Marco Colombetti, Davide Eynard and An- dreas Kaltenbrunner for their precious advices.
REFERENCES
[1] B. Adler, L. de Alfaro, I. Pye, and V. Raman.
Measuring author contribution to the Wikipedia. In Proceedings of WikiSym, 2008. [2] R. Almeida, B. Mozafari, and J. Cho. On the evolution
of Wikipedia. In Proceedings of ICWSM, 2007.
3thanks to DBpedia knowledge base: http://dbpedia.org/
[3] O. Arazy and O. Nov. Determinants of Wikipedia
quality: the roles of global and local contribution inequality. In Proceedings of CSCW, 2010. [4] A. L. Barab´asi, H. Jeong, Z. N´eda, E. Ravasz,
A. Schubert, and T. Vicsek. Evolution of the social network of scientific collaborations. Physica A: Statistical Mechanics and its Applications, 311(3-4):590 – 614, 2002. [5] R. Biuk-Aghai. Visualizing co-authorship networks in
online Wikipedia. Communications and Information Technologies, 737–742, 2006. [6] U. Brandes, P. Kenis, J. Lerner, and D. van Raaij.
Network analysis of collaboration structure in Wikipedia. In Proceedings of WWW, 2009. [7] S. L. Bryant, A. Forte, and A. Bruckman. Becoming
wikipedian: Transformation of participation in a collaborative online encyclopedia. In Proceedings of SIGGROUP, 2005. [8] P. Bonacich. Power and centrality: A family of
measures. American Journal of Sociology, 92(5):1170–1182, 1987. [9] C. Cotta and J. J. M. Guerv´os. Where is evolutionary
computation going? a temporal analysis of the ec community. Genetic Programming and Evolvable Machines, 8(3):239–253, 2007. [10] D. J. Crandall, D. Cosley, D. P. Huttenlocher, J. M.
Kleinberg, and S. Suri. Feedback effects between similarity and social influence in online communities. In Proceedings of KDD, 2008. [11] G. Csardi, T. Nepusz. The igraph software package for
complex network research. In InterJournal Complex Systems, 2006. [12] L. C. Freeman. A Set of Measures of Centrality Based
on Betweenness. Sociometry, 40(1):35–41, 1977. [13] E. Gleave, H. T. Welser, T. M. Lento, and M. A.
Smith. A conceptual and operational definition of ’social role’ in online community. In Proceedings of HICSS, 2009. [14] V. G´omez, A. Kaltenbrunner, and V. L´opez.
Statistical analysis of the social network and discussion threads in Slashdot. In Proceeding of WWW, 2008. [15] A. Halfaker, A. Kittur, R. Kraut, and J. Riedl. A jury
of your peers: quality, experience and ownership in Wikipedia. In Proceedings of WikiSym, 2009. [16] P. Holme, C. R. Edling, and F. Liljeros. Structure and
time-evolution of an internet dating community. Social Networks, 26(2):155–174, May 2004. [17] H. Hu and X. Wang. Disassortative mixing in online
social networks. Europhys. Lett., 2009. [18] T. Iba, K. Nemoto, B. Peters and P. A. Gloor.
Analyzing the Creative Editing Behavior of Wikipedia Editors: Through Dynamic Social Network. Procedia - Social and Behavioral Sciences, 2010. [19] A. Kittur, E. Chi, B. Pendleton, B. Suh, and
T. Mytkowicz. Power of the few vs. wisdom of the crowd: Wikipedia and the rise of the bourgeoisie. World Wide Web, 1(2):19, 2007. [20] A. Kittur, E. H. Chi, and B. Suh. What’s in
Wikipedia?: mapping topics and conflict using socially annotated category structure. In Proceedings of CHI, 2009.
[21] A. Kittur and R. E. Kraut. Harnessing the wisdom of
crowds in Wikipedia: quality through coordination. In Proceedings of CSCW, 2008. [22] R. Klamma and C. Haasler. Dynamic network analysis
of wikis. In H. Maurer, F. Kappe, W. Haas, and K. Tochtermann, editors, Proceedings of I-KNOW, 2008. [23] N. Korfiatis, M. Poulos, and G. Bokos. Evaluating
authoritative sources using social networks: An insight from Wikipedia. Online Information Review, 30(3):252–262, 2006. [24] D. Laniado, R. Tasso, Y. Volkovich A. Kaltenbrunner.
When the Wikipedians talk: network and tree structure of Wikipedia discussion pages. In Proceedings of ICWSM, 2011. [25] C. M¨uller-Birn, J. Lehmann, and S. Jeschke. A
composite calculation for author activity in wikis: Accuracy needed. Proceedings of Web Intelligence and Intelligent Agent Technology, 2009. [26] F. Nazir and H. Takeda. Extraction and analysis of
tripartite relationships from Wikipedia. IEEE International Symposium on Technology and Society, 1–13, 2008. [27] M. Newman. Coauthorship networks and patterns of
scientific collaboration. PNAS, 101(suppl
1):5200–5205, 2004. [28] M. Newman and J. Park. Why social networks are
different from other types of networks. Physical Review E, 68(3):36122, 2003. [29] M. E. J. Newman. The structure of scientific
collaboration networks. PNAS, 98(2):404–409, 2001. [30] M. E. J. Newman. Assortative mixing in networks.
Physical Review Letters, 89(20):208701+, Oct. 2002. [31] F. Ortega, J. M. Gonzalez-Barahona, and G. Robles.
On the inequality of contributions to Wikipedia. In Proceedings of HICSS, 2008. [32] R. Priedhorsky, J. Chen, S. T. K. Lam, K. Panciera,
L. Terveen, and J. Riedl. Creating, destroying, and restoring value in Wikipedia. In Proceedings of SIGGROUP, 2007. [33] E. Raymond. The cathedral and the bazaar.
Knowledge, Technology & Policy, 12(3):23–49, 1999. [34] B. Suh, G. Convertino, E. H. Chi and P. Pirolli. The
singularity is not near: slowing growth of Wikipedia. In Procceedings of WikiSym, 2009. [35] L. V.-S. Tang, R. P. Biuk-Aghai, and S. Fong. A
method for measuring co-authorship relationships in mediawiki. Proceedings of WikiSym, 2008. [36] J. Voss. Measuring Wikipedia. In Proceedings
International Conference of the International Society for Scientometrics and Informetrics, 2005. [37] S. Wasserman and K. Faust. Social Network Analysis:
Methods and Applications. Cambridge University Press, 1994.
Source figures and tables
The following source-faithful visual renderings preserve the paper’s figures and tables.
Figure 1
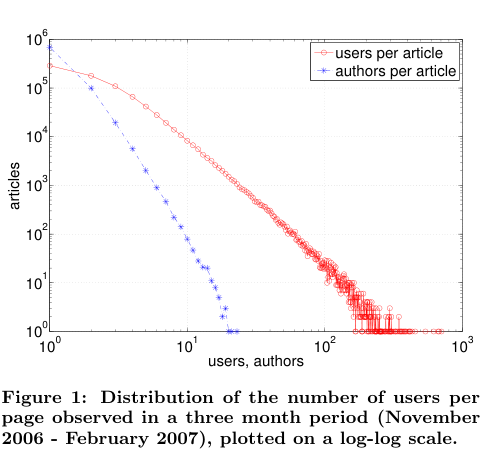
Figure 1: Distribution of the number of users per page.
Figure 2
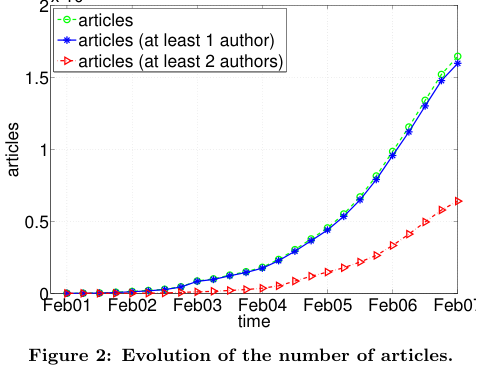
Figure 2: Evolution of the number of articles.
Figure 3
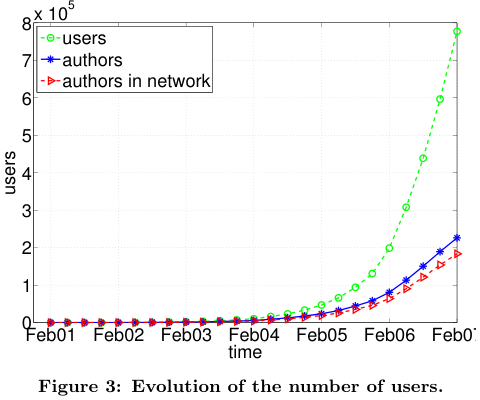
Figure 3: Evolution of the number of users.
Table 1
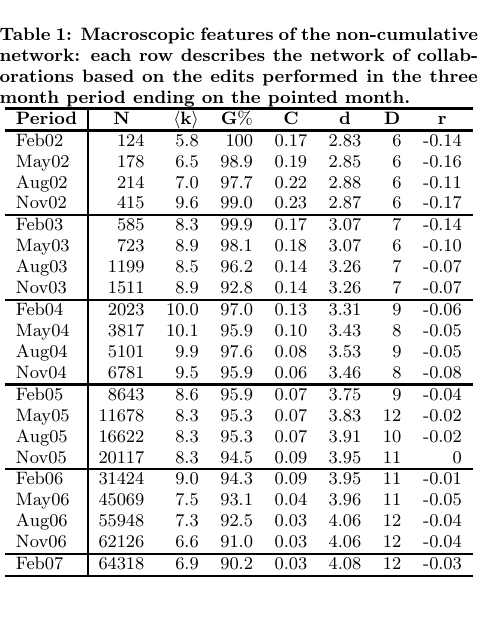
Table 1: Macroscopic features of the non-cumulative network.
Table 2
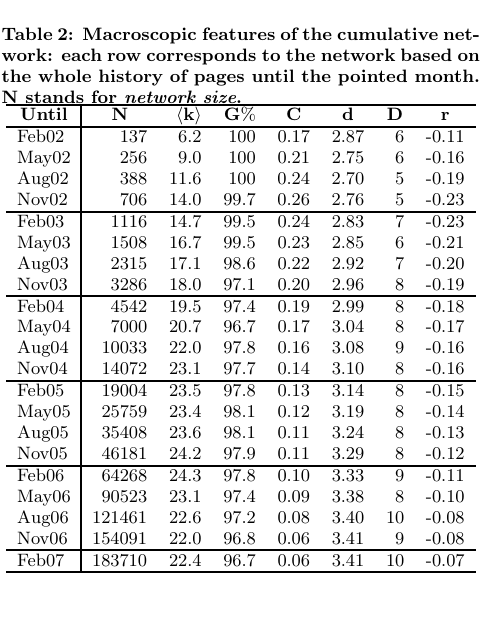
Table 2: Macroscopic features of the cumulative network.
Figure 4
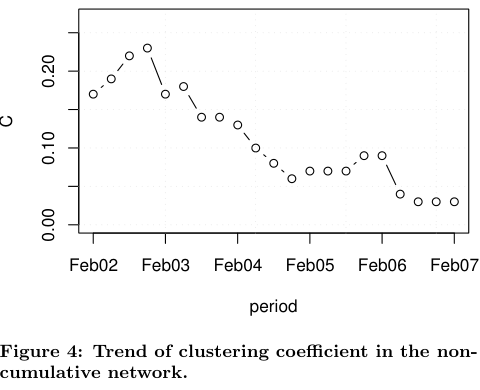
Figure 4: Trend of clustering coefficient in the non-cumulative network.
Figure 5
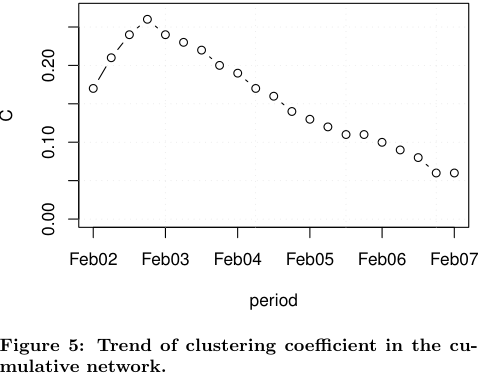
Figure 5: Trend of clustering coefficient in the cumulative network.
Figure 6
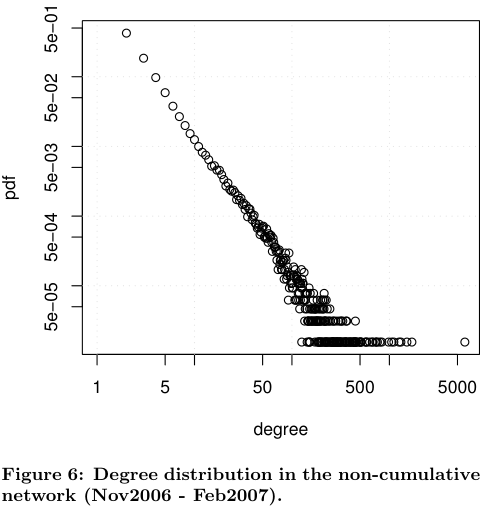
Figure 6: Degree distribution in the non-cumulative network.
Figure 7
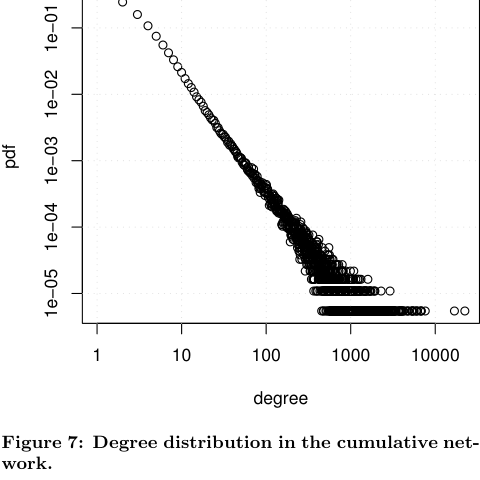
Figure 7: Degree distribution in the cumulative network.
Figure 8
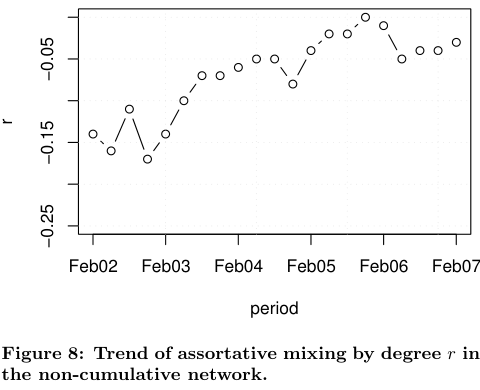
Figure 8: Trend of assortative mixing by degree.
Figure 9
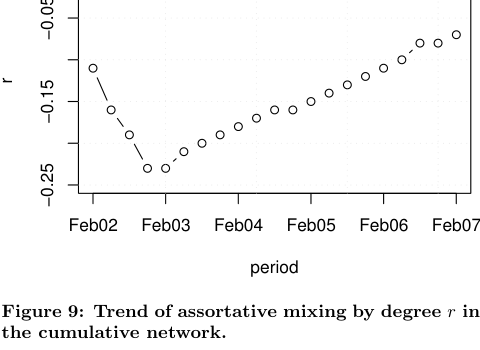
Figure 9: Trend of assortative mixing by degree.
Table 3
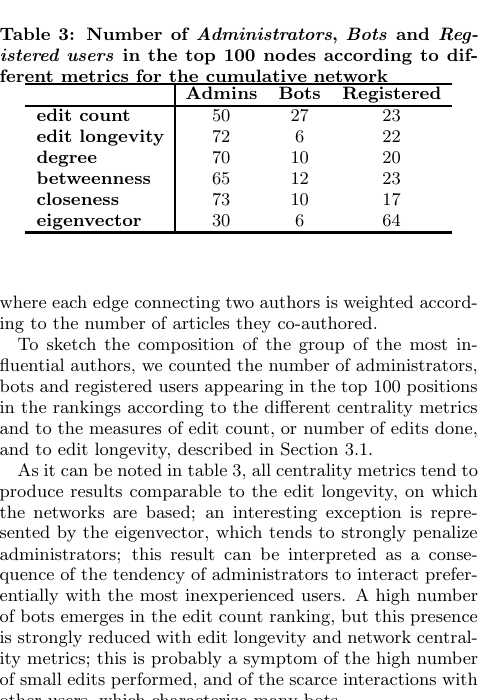
Table 3: Number of Administrators, Bots and Registered users in top nodes.
Table 4
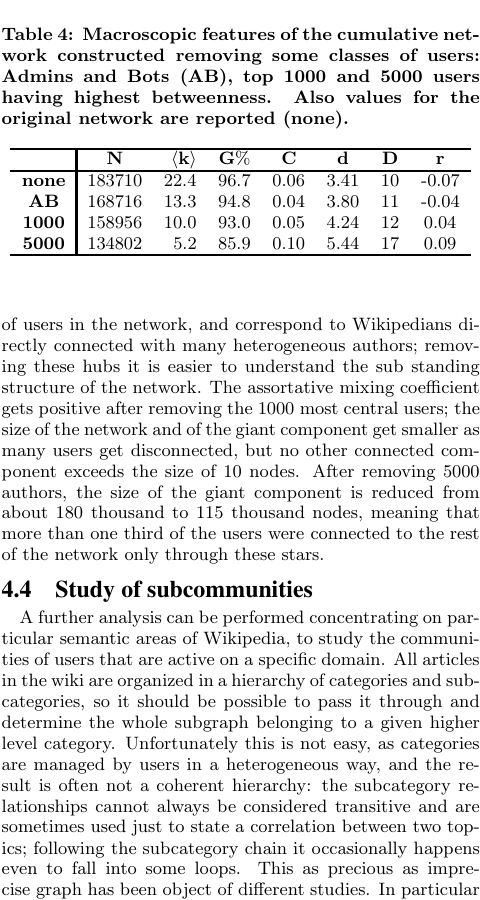
Table 4: Macroscopic features of cumulative networks after removals.
Table 5
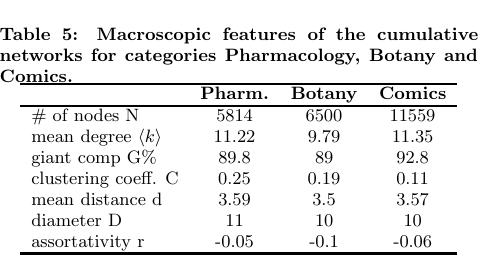
Table 5: Macroscopic features of category networks.
Table 6
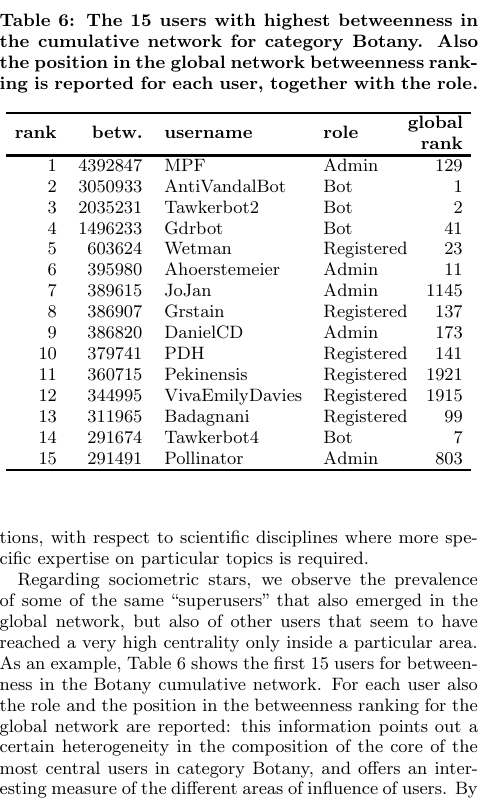
Table 6: Users with highest betweenness in category Botany.
Do you like what you are reading? Subscribe to receive updates.
Unsubscribe anytime